
Nikkei India numbers show an expansionary trend, while CMIE data indicates a continuing fall in economy.
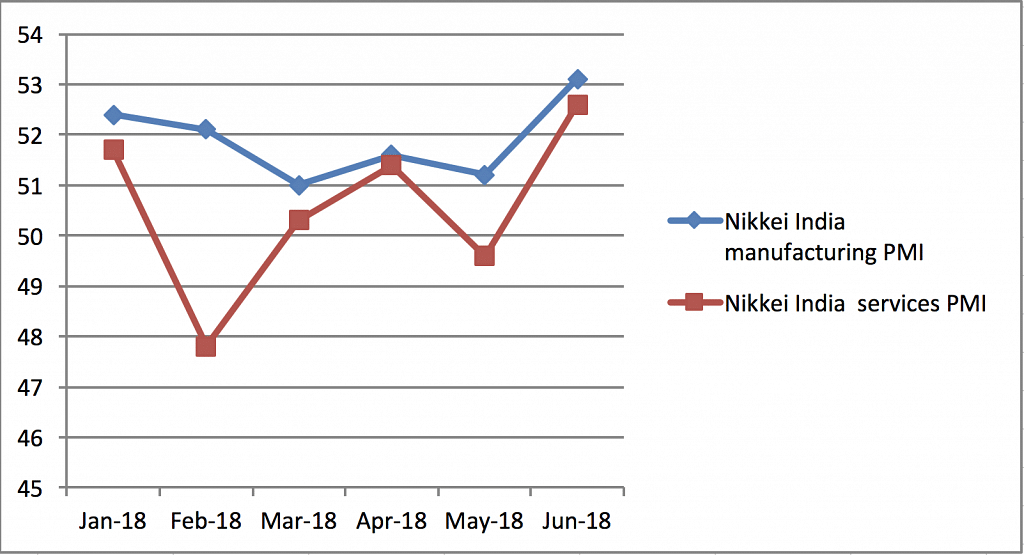
New Delhi: Two sets of statistic released last week paint divergent pictures about the Indian economy. Nikkei India purchasing managers’ index (PMI) for manufacturing and services in the month of June was valued at 53.1 and 52.6, respectively. A value above 50 shows an expansionary trend in the economy. June PMI values for both manufacturing and services are the highest in 2018.
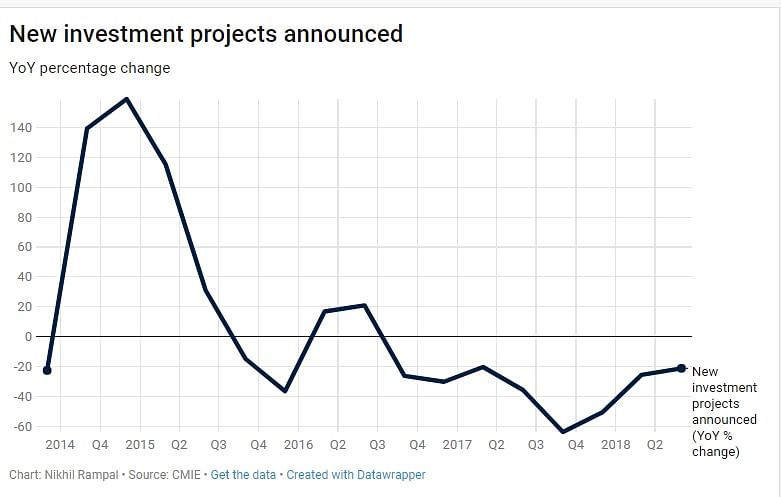
These trends stand in sharp contrast to the statistics from Centre for Monitoring Indian Economy’s (CMIE) capex database which shows a continuous fall in value of new project announcements. These numbers are widely used as a measure of investment sentiment in the economy. This value has been witnessing a decline for the past eight quarters.
Index of Industrial Production (IIP) paints a mixed picture. While IIP growth in April 2018 (latest available figures) was 50 basis points higher than the growth in March 2018, it was more than 200 basis points lower than the figures for January and February 2018. One basis point is one hundredth of a percentage point. Base effect disruptions caused due to demonetisation could have played a role in the higher growth figures for IIP in January and February.
While IIP figures for May and June 2018 would shed more light on this confusion, they will not be available for some time. What do these divergent trends tell us about the level of economic activity in the Indian economy?
Madan Sabnavis, chief economist at CARE Ratings said that the PMI data is intrinsically flawed when it comes to interpreting real production. This, Sabnavis said, is because it only covers the private sector and is based on binary questionnaire where you say yes or no. While PMI is a useful quick indicator, it never gels with the IIP numbers, Sabnavis added. Explaining the divergent trend between PMI and capex numbers, Sabnavis said “Investment is different from production as we are dealing only with fresh capital being installed which has not increased. This is as capacity utilisation rates are low and demand for investment is low. Therefore this is true picture on capital formation.”
Aditi Nayar, principal economist at rating agency ICRA said that an improvement in both rural and urban consumption driven by a modest pickup in economic growth is likely to bolster capacity utilisation in various sectors, which could lead to a broad-based capacity addition by the private sector in the second half of the ongoing fiscal year.
What actually happens in the next few months will depend on pulls and pressure from various forces. Rise in Minimum Support Prices and a normal monsoon is likely to boost consumption demand. On the other hand, a rise in inflation, which could lead to another rate hike by the RBI could further discourage investment in the economy. We will have more clarity on this when GDP figures for the June quarter will be released around August.
By special arrangement with ![]()
More clarity when the GDP figures are released … To some, it would appear that the GDP figures add to the fog.
Illogical conclusion. If there is unutilised capacity in the economy, it would continue to grow even when no new investment is taking place. These two do not move in tandem.