

Without capturing household-level data frequently, it is futile to analyse employment expectations.
In a recent article for The Indian Express, economist and columnist Surjit Bhalla macro-analysed India’s job growth problem with some interesting, yet disputable facts. In his article, Bhalla emphasises how India’s ‘perceived jobless growth’ crisis is not due to the lack of growth of jobs per se but because of an increased demand for government jobs—that is, for relatively higher incomes.
He suggests that the economy does not require an annual growth of 12 million jobs for those entering the workforce, contradicting an earlier argument made by former Reserve Bank of India (RBI) governor and economist Raghuram Rajan.
At around the same time, Centre for Monitoring Indian Economy (CMIE), in its recent report on jobs in India, revealed how the number of those un(der)employed in India is rising with each passing year, stating that more than ‘11 million jobs were lost in 2018-19 alone’—significantly, 9.1 million were lost in rural areas (home to two-thirds of India’s population) and 1.8 million in urban areas.
These contrarian findings raise vital questions on how we go about interpreting the employment scenario in India, particularly when (lack of) employment has become a major electoral issue in 2019.
CMIE’s study seems more accurate in at least disaggregating the employment data and giving us a more comprehensive picture on the underlying trends. I see at least four major problems with such analysis as Bhalla’s. It suffers from what I call the hyper-macro sizing problem, particularly relevant to the employment discourse in India.
Also read: Modi’s quota bill is just a band-aid solution and doesn’t promise more jobs
An overtly broader macro view tends to underestimate the micro patterns, and often presents oversimplified generalisations.
First, with annual figures and less frequent employment data for households, it is difficult to understand actual trends across the sectoral occupations (from agriculture to services) for people entering the workforce.
With unit-level employment data on households across states in India being so discrete, scattered and less frequent, one can hardly give weightage to hyper-macro documented trends, based on changes in (annual) population-related data alone (as done by Bhalla in his analysis).
For example, while it is possible to know how employment growth fared in sectors of manufacturing and services over a period of time (at the national level), it is difficult to know how many people left a job in manufacturing to join later a job in services within a short period of time (in the absence of household employment data).
Such micro-based household findings are particularly important in macro-economic exercises observing the extent and frequency at which most individuals are switching between jobs on a regular basis.
In the Indian context, such ‘switches’ between jobs and sectoral occupations have increased since the 2000s and are connected with wage-based incentives.
Former NITI Aayog vice-chairman Arvind Panagariya, a day before leaving office, submitted a task report to the Prime Minister’s Office (PMO) highlighting this problem and argued for a change in the employment data collection method to bring it in closer alignment with the robustness of US’s employment data.
He sought to make such data available more frequently for specific household/occupational scenarios. One would want to know why nothing happened since the report was submitted and the government’s reasons for not making changes to the employment data methods.
Further, issues regarding the sampling of employment data make some results highly misleading (as discussed earlier here). Most samples undertaken in studies on employment still tend to accord higher weightage to the private sector—87.13 per cent—whereas only 12.87 per cent is assigned to the public sector (including public sector undertakings and other government units).
Also read: 3 key themes that will impact growth of Indian economy in 2019
Second, Bhalla’s statement that ‘the increase in education enrolment of women explains the entire decline in LFPR (Labour Force Participation Rate) of women observed between 1983 and 2011-12’ requires deeper, analytical scrutiny.
As argued earlier in a detailed analysis on sector-wise differences in the female-male labour force participation rate (among the working age population group of 15-45 years), we noted how even though women’s literacy levels in primary areas of education (government and private) have increased considerably over the last two decades (thanks to the Right To Education (RTE) and other state-focused programmes), the enrolment numbers for women in secondary and tertiary areas of education (especially in rural and semi-urban areas) still remain highly unequal—the latter is a major concern.
And, this fact changes how we perceive the links among education enrolment for women across each level of education, their employability and expectations.
Additionally, the female-male labour force participation rates across sectors offer interesting insights which shouldn’t be ignored while hyper-macro sizing employment statistics.
Figure 1 below shows how sectors like healthcare and education, which receive least public spending focus from the state, reflect a more gender-balanced workforce as against other sectors like trade, transport, construction, manufacturing etc where most jobs (as a result of increased private investment) have been created on an annual basis (since the early 2000s).
Figure 1: Estimated female and male employment in eight sectors (in lakh)
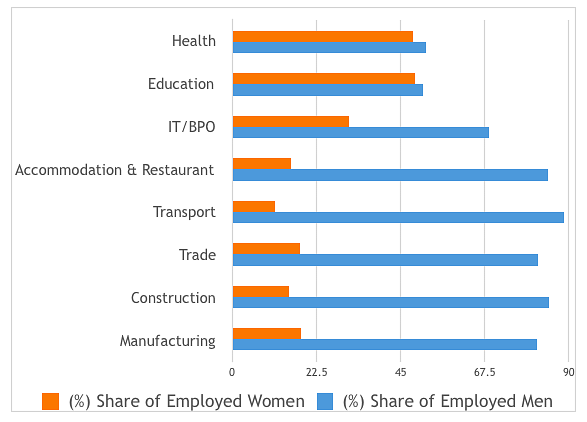
Gendered patterns in jobs with inter and intra sectoral focus remains key for a deeply fragmented employment landscape like India and any generalisations—say between education enrolment and LFPR—must be avoided in the face of substantial asymmetrical information across sectors.
Thirdly, one of the most important aspects in India’s employment landscape is the scale and extent of our unorganised, informal workforce. There is still a wide divergence between those seen as ‘self-employed’ versus ‘those employed in the organised, formal economy’.
This includes most citizens employed in vulnerable and unregulated areas of agriculture, construction, manufacturing among other (semi/un) regulated activities.
Also read: Why India’s economy needs Eco-normics – not Left vs Right debate
A lot has already been written on this subject and on estimating the informalisation of workforce and its scale across sectors.
Therefore, any estimate on how many good quality jobs are needed in the organised sector on an annual basis requires one to also include how people—within the unorganised informal sector—may move to transfer to the organised workforce, given their respective skill sets.
This means one cannot just look at the number of people entering the workforce for estimating the number of good quality jobs that need to be created.
One must accommodate for how many people with bad quality jobs (in the absence of alternatives) may seek to move from those to good quality, well-paying ones (once created).
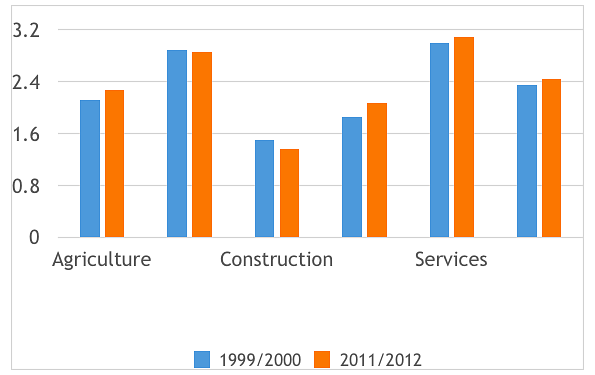
Figure 2: Employment structure index for production sectors (unorganised)
Further, one also needs to incorporate more micro-based ethnographic observations in validating any statistical extrapolations made in employment statistics (sans focus on informal, vulnerable groups).
Fourthly, as discussed earlier, discussions on job creation or destruction have a direct connotation with real wage growth and incomes across sectors. Without looking at the direction of real wages over a period of time, it is difficult to gauge the employment expectations of those joining in the workforce or frictionally moving between occupations.
In India’s context, the last few years saw a tremendous decline in real wages that was worse for rural areas. Somewhere, this also explains why job destruction (as cited by CMIE) has strongly impacted the rural section of India’s population since demonetisation.
Similar to the US, wage growth extractions (using tax data) need to be measured in conjunction with scenarios of employment growth.
Also read: How India can get its finance ministers to stop fudging
These four problems detail some fundamental concerns with the discourse espoused by Surjit Bhalla and others with such hyper-macro sized analysis on the jobs situation.
Without a robust and more frequent household-level focus, it is redundant to argue or analyse the employment expectations of those present in or joining the workforce.
Micro-surveys and ethnographic tools are also critical in such macro-economic exercises and must become a norm over time in our economic policy discourse where frequent data collation and validation still remains a challenge.
The author is Assistant Professor of Economics at O.P. Jindal Global University and a visiting professor at Carleton University, Ottawa.
I agree with the author that lack of data makes employment analysis very challenging. But then, it is pointless to challenge one view point as being superior to another. It has been my sincere effort to not confine myself to any echo-chambers, and I do make and honest effort to follow every viewpoint. But disappointingly, those like Bhalla will use macro analyses almost exclusively, while the contrarian view will switch to a telling of anecdotes. None serve very useful purposes.
Frankly Bhalla gets very little right. His use of statistical methods is self serving and unscientific. Whenever he presents a model, he conveniently forgets to display model-fit indicators.
Frequent household level data collection is simply too difficult for a country like India. It requires methodical data collection points like tracking social welfare payments, tax payments, etc across the country’s population which is simply not in place in India.
In our country, getting household level data that is consistent across the country can only be obtained through an exercise like the Census. The biggest administrative exercise conducted in India is the national Census and that is only conducted once in a decade.
Give me an honest woodcutter any day over this kind of incandescent intellect.