


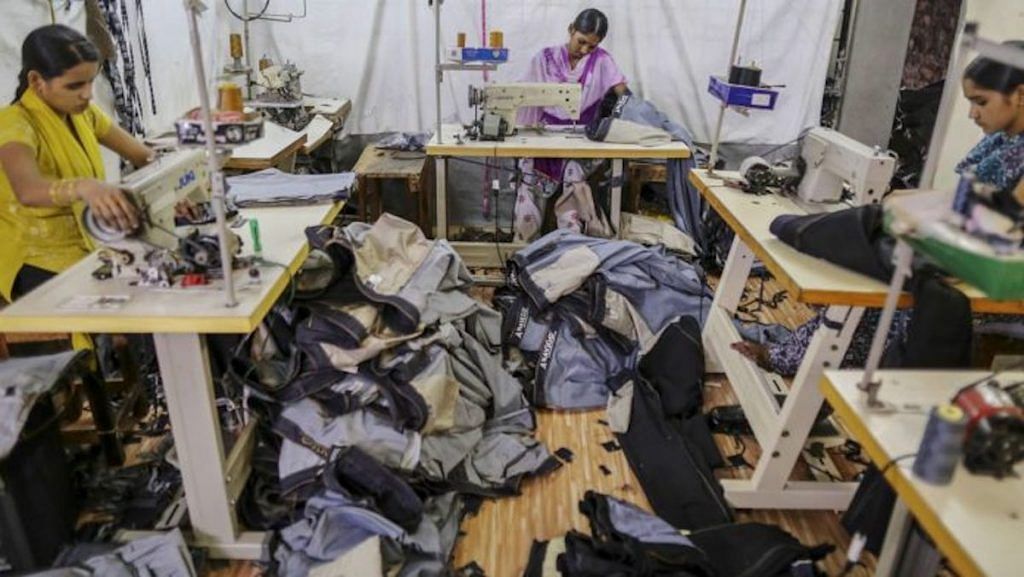
The Narendra Modi government’s Budget for 2021-22 has announced a slew of measures to spur job creation in manufacturing and construction sectors. It aims, among other projects, to create seven mega textile parks in India and several infrastructure projects. We draw insights from the different development models followed by the four key prosperous Indian states to highlight why it is imperative to get ‘Make in India’ to really work this time around.
Economy of four states
Roughly 40 per cent of India’s economic activity comes from Maharashtra, Gujarat, Tamil Nadu, and Karnataka, as per data from the National Accounts Statistics (NAS). The average prosperity level in these four states, measured in terms of per-person real income, is similar – around Rs 12,000-13,000 per month in 2018-19. For the rest of India, the same was only around Rs 7,600.
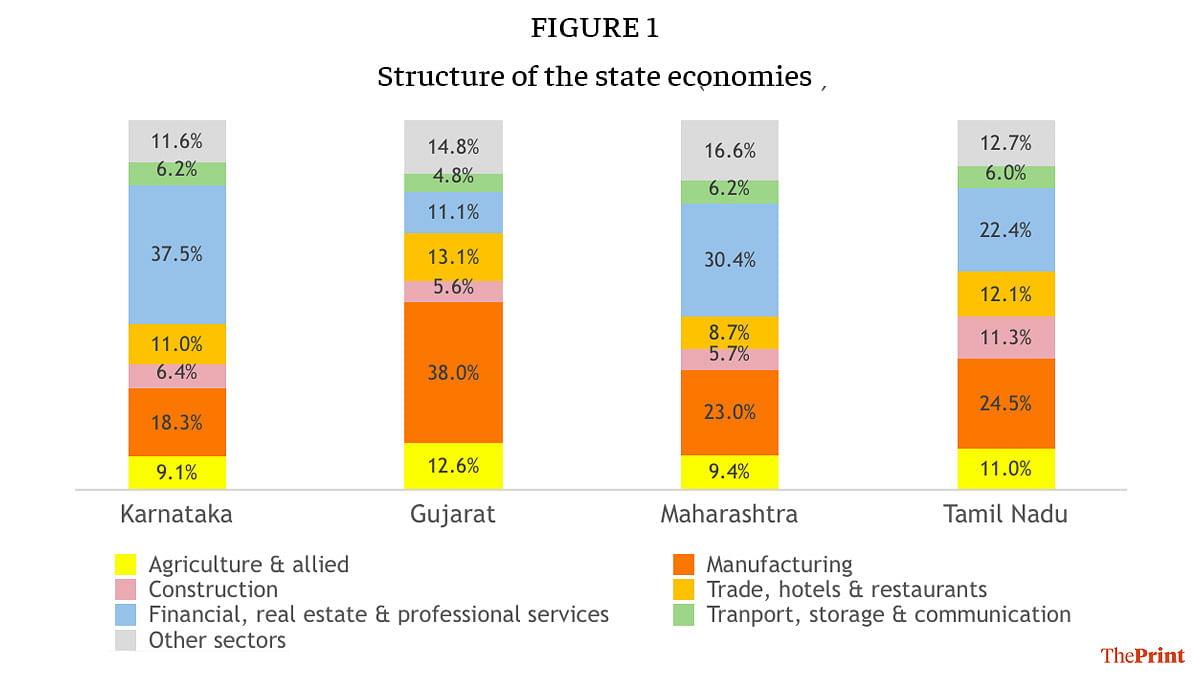
It is interesting that these states have reached their current similar prosperity levels by following different development models [Figure 1]. While in all four states agriculture now accounts for only 10-15 per cent of the economy, the rest of their economic structure differs markedly in terms of the importance of manufacturing and high-tech services.
In 2018-19, the highest gross value added (GVA) comes from the manufacturing sector in Gujarat (38 per cent of total value added), while the financial, real estate and professional services account for a similar share in Karnataka. In contrast, the share of manufacturing is only about 18 per cent in Karnataka. Tamil Nadu has the most balanced growth model with manufacturing and high-tech services each contributing nearly one-fourth of the GVA. Maharashtra’s growth is tilted towards high-tech services, although not to the same extent as in Karnataka.
It is important to note that the shares reported here have been calculated using the new GDP series with the base year 2011-12 as released by NAS. The new series has upwardly revised the shares of some states in India’s economy, especially that of Karnataka. While the accuracy of the sectoral shares may be doubtful, it is known that the development model of Karnataka is based on the growth of high-skilled services.

Also read: Execution is what will determine if India can spend its way to a V-shaped recovery
Manufacturing vs high-skilled sectors
How do the sectoral trajectories of local economies influence the inclusiveness of growth? What implications does it have on inequality? Put differently, while the average prosperity may be similar, does a particular pattern of growth leave more people behind in relative terms?
The comparison of the sectoral GVA (from the NAS) and employment shares (from the Periodic Labour Force Survey or PLFS) for 2017-18 at the national level brings out starkly a well-known fact – among the non-farm sectors, construction, trade, hotels and restaurants, and manufacturing are the labour-intensive sectors (Figure 2). Economic development, especially based on manufacturing, tends to create better quality jobs and benefit people more when they move out of farming.
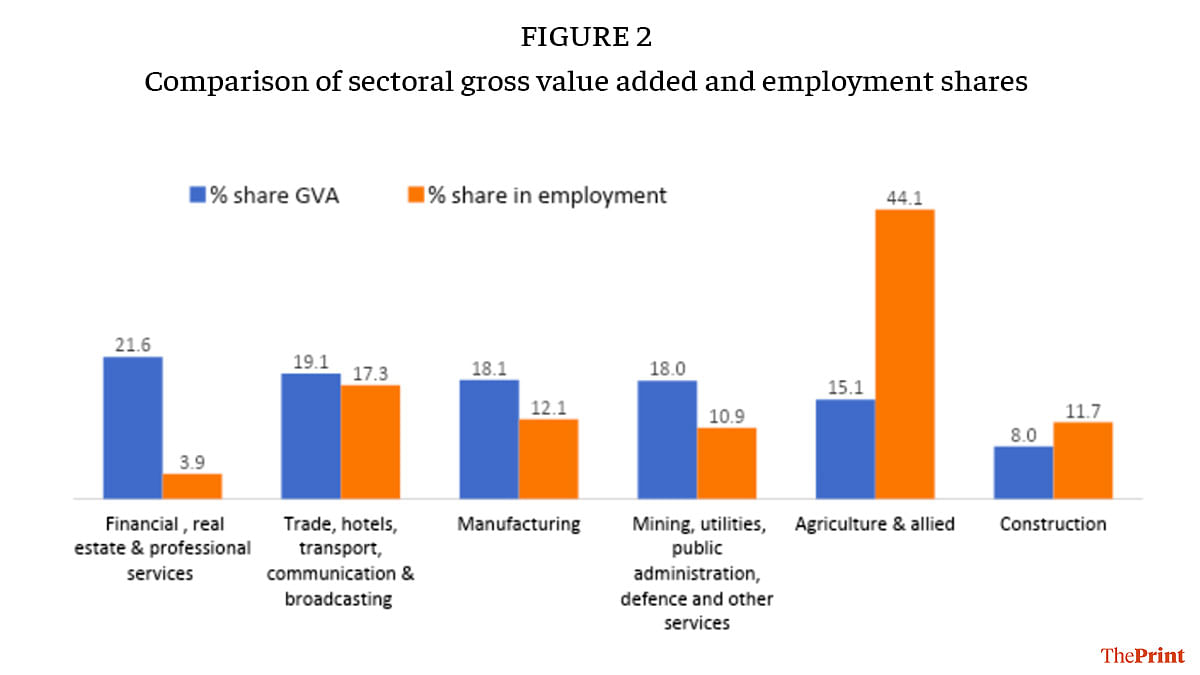
In contrast, a higher share of skilled professional and financial services, given the nature of their tech-intensive production functions, are inherently more productive, thereby requiring a much smaller proportion of employment. While the largest gross value added is created by these sectors at the national level (nearly 22 per cent), it directly employs the lowest proportion of labour (4 per cent). While the forward and backward linkages of high-skilled sectors do create jobs in other sectors, the indirect job creation tends to be in low-skilled services and construction.
Also read: In ‘progressive’ Tamil Nadu, Karnataka, only 1 in 5 young urban women in paid work
Of a refrigerator and a house
Given data limitations in the employment numbers at the state level and the treatment of migrant workers, we proxy the inclusiveness of growth by households’ acquisition of assets and the quality of housing. The latest year for which asset ownership data is available for Indian states is 2015-16 (4th round of National Family Health Survey or NFHS). While the survey provides ownership data on several assets such as vehicles, computers, televisions, mixers and so on, the asset ownership does not purely depend on households’ affordability. For example, in Tamil Nadu, television sets and mixers have been given free to a section of the population by earlier governments. Similarly, the decision to purchase a vehicle also depends on the state of public transport and geography of the region, distance from home to workplace, and so on.
After careful consideration, we take the refrigerator ownership as a proxy for how far the prosperity has spread in these states. Higher is the inclusiveness of growth with more quality job creation, higher should be refrigerator ownership. There may be cultural reasons such as a preference for eating fresh food, but these are unlikely to vary among states. The refrigerator requires a complementary good in terms of reliable power supply and if the lack of power supply is what holds people back from acquiring an asset, it too reflects on the lack of inclusive growth.
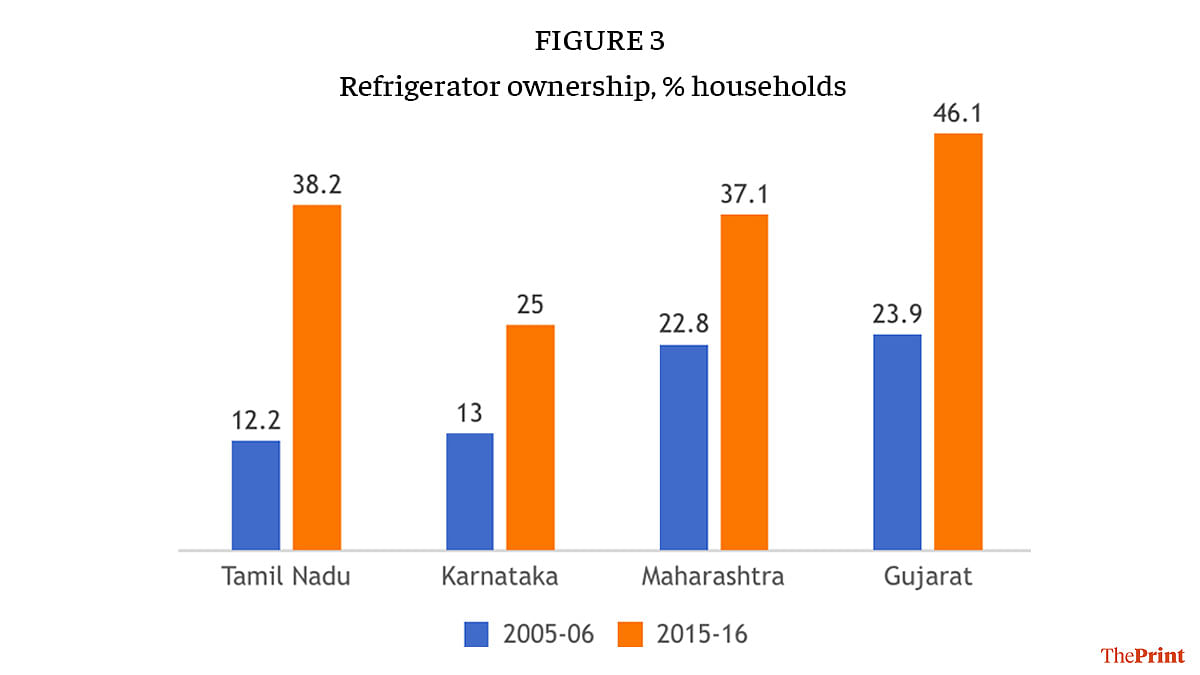
Gujarat is a clear leader in terms of the percentage of households owning a refrigerator at 46 per cent in 2015-16, followed by Tamil Nadu. Tamil Nadu leads in terms of the increase in refrigerator ownership between 2005-06 and 2015-16. In contrast, Karnataka, which had a similar level of refrigerator ownership as Tamil Nadu in 2005-06, was way behind 10 years later with only 1 in 4 households owning it (Figure 3). This is a similar level of ownership that Gujarat had seen 10 years earlier. It appears that the states with more balanced development models or a focus on labour-intensive sectors can spread prosperity wider.
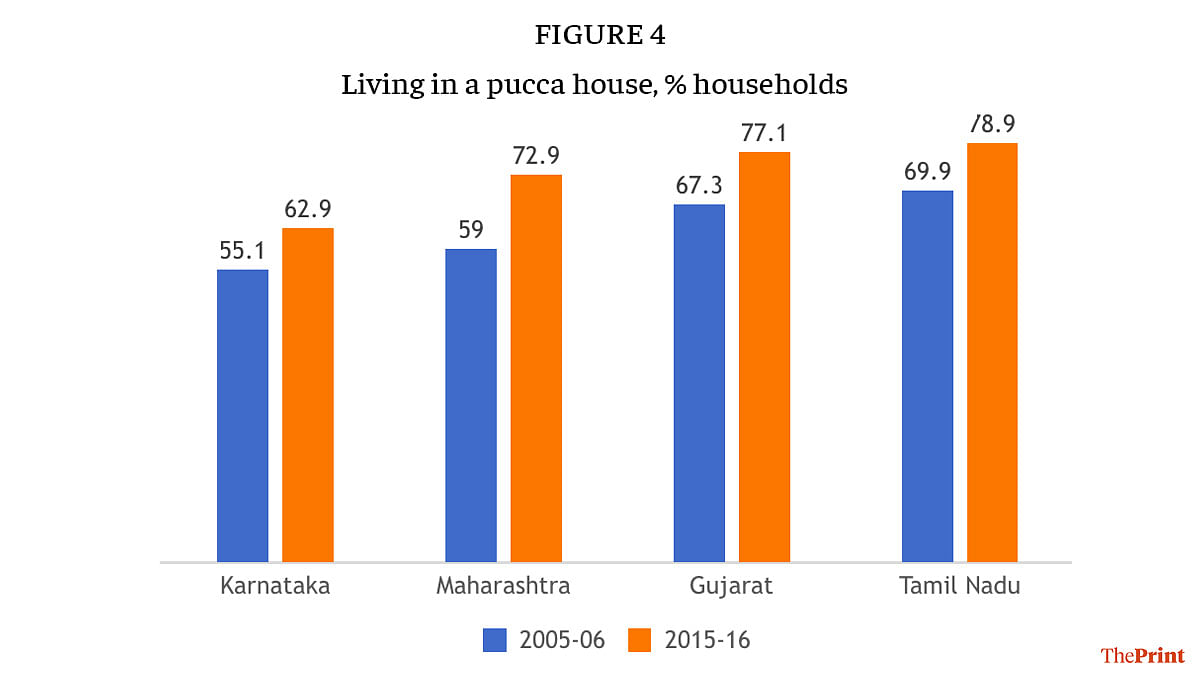
Another indicator that provides insights into the spread of prosperity is the quality of housing, either owned or rented (Figure 4). Once again, in terms of good quality housing, Tamil Nadu and Gujarat lead while Karnataka reports its share of households living in a pucca house in 2015-16 well below the levels seen in Gujarat and Tamil Nadu a decade earlier.
In sum, the experience of key Indian states on their road to prosperity seems to reiterate the findings in the international context that more balanced economic development is a key to more inclusive growth.
This article is the third in the workforce series. Read all the articles here.
Vidya Mahambare is Professor of Economics, Great Lakes Institute of Management. Sowmya Dhanaraj is Assistant Professor of Economics, Madras School of Economics. Sankalp Sharma is post-graduate student, Madras School of Economics. Views are personal.