


Ask any economist what India exported to Malaysia last quarter and you’ll get a precise answer within minutes. Ask what Maharashtra exported to Uttar Pradesh, and the national statistical system offers almost nothing. Seven decades after Independence, the flows of goods between India’s states remain among the most consequential but the least-measured dimensions of the national economy.
That gap may now have a remedy. In April 2018, the GST rollout mandated the e-way bill: a digital compliance document required every time goods worth more than Rs 50,000 cross a state boundary or travel a specified distance within a state. Today, around 9 crore such records are generated every month, each capturing the origin, destination, declared value, and commodity classification of a consignment. The Center of Data for Economic Decision-making (CoDED) attempted to repurpose these compliance records as a high-frequency measure of India’s internal trade. To our knowledge, it’s the first systematic attempt to do so.
Using publicly available monthly e-way bill statistics for all states from 2018-19 to 2024-25, we constructed three trade flow measures per state: intra-state trade, inter-state outward trade (the state’s “exports” to other states), and inter-state inward trade (its “imports”). We normalised each by the Gross State Domestic Product (the same trade-to-GDP ratio international economists use) to produce figures comparable across states of vastly different sizes.
The aggregate picture offers important reassurance: every state in the dataset shows a sharp contraction in at least one trade flow around 2020. The Covid-19 shock is clearly legible in the series, confirming that e-way bills respond to real economic disruptions. The RBI’s nowcasting frameworks have already used e-way bill volumes as a business cycle proxy. Our contribution is different: we use them to reveal the structural architecture of internal trade, not just its cyclical pulse.
Two states, two stories
The contrast between Gujarat and Bihar captures India’s internal trade divergence most vividly.
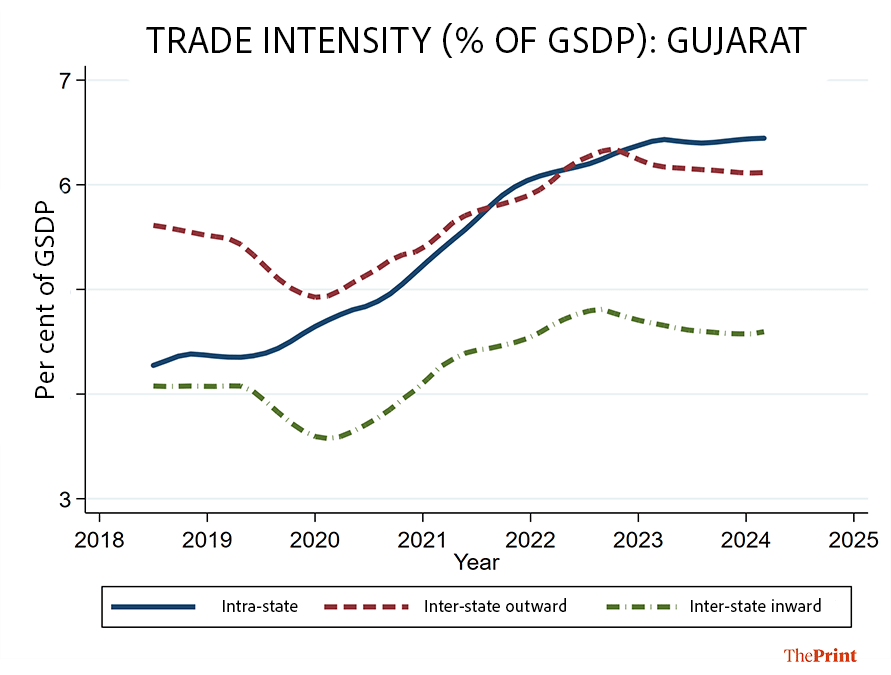
Gujarat is a net exporter throughout the observation period. But the more remarkable trend is in the intra-state trade intensity, which rose from roughly 4.3 per cent of GSDP in 2018-19 to approximately 6.5 per cent by 2024-25. Around 2022, intra-state intensity crossed above outward intensity (Gujarat’s goods going to other states) and stayed there. This is consistent with Gujarat’s role as a major port state, where goods move extensively within state borders toward export points. The domestic economy is trading increasingly with itself, a sign of supply chain deepening and formalisation.
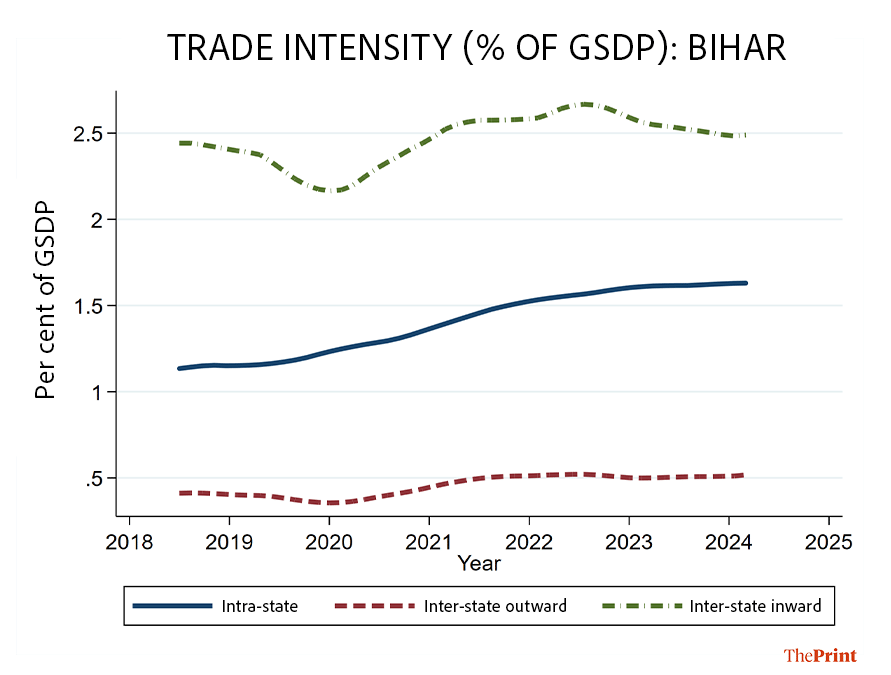
Bihar presents a near-mirror image, and a more troubling one. Inter-state inward intensity (goods from other states coming into Bihar) remained at approximately 2.2-2.7 per cent of GSDP throughout. Inter-state outward intensity was at a flat 0.4-0.5 per cent for the entirety of the seven–year duration. The 5:1 inward-to-outward ratio is the largest deficit in our dataset. More significant than the magnitude is the shape: the outward series shows no trend whatsoever. Bihar is not building the industrial or commercial capacity needed to reduce its dependence on goods produced elsewhere.
Not all net importers are alike
A critical lesson from the state-level analysis is that identical trade positions can arise from structurally different circumstances, and this matters enormously for policy design.
Karnataka, like Bihar, is also a net importer in the interstate dimension. Yet, its rising intra-state intensity reflects a services-led, technologically intensive economy drawing manufactured inputs from elsewhere. It doesn’t lack productive capacity. On the other hand, Kerala’s inward intensity is sustained by remittance-funded consumption, with limited manufacturing ambition.
Bihar is a net importer because it lacks formal industrial capacity. Karnataka, because its economy specialises in services. Kerala, because remittances fund demand that local production doesn’t meet. Treating these as the same policy problem, and responding with identical instruments, would be a categorical error.
Also read: How a Gujarat dairy district is turning cow dung into cheaper fuel and carbon credits
What the data could do, if released
These findings rest on publicly available, state-level aggregate data. But the GST network holds (and does not release) commodity-level and origin-destination e-way bill data. Every bill records the HSN code of the commodity and the specific origin and destination states. This information is aggregated away in the public statistics. That is an institutional choice with real costs.
Making the data accessible would unlock three things that state-level aggregates simply cannot.
First, it would help policymakers identify specific product categories in which a state is a persistent net importer despite having plausible production capacity. This would shift industrial policy conversations from broad sectoral ambitions to product-level opportunities grounded in revealed trade flows.
Second, it would enable the mapping of domestic value chains: Where do states source intermediate goods from other states? This enquiry would reveal targeted opportunities to build intra-state supplier networks and reduce logistics costs.
Third, and most ambitiously, the data would permit the construction of an Indian internal trade matrix (an origin-destination table for goods flows across all state pairs) that would provide the empirical foundation for a generation of research on internal trade costs and regional specialisation. Atkin and Donaldson (2015) showed, using price data from Ethiopia and Nigeria, that internal trade costs in developing economies can exceed international ones, and that the welfare gains from reducing them can be larger than further external liberalisation. India cannot even begin that calculation without knowing where its goods actually go.
The precedent exists within India’s own system. The Directorate General of Commercial Intelligence and Statistics publishes detailed commodity-level customs data that underpins all of India’s international trade research. The RBI publishes granular credit flow data by district and sector. So, the GST Council’s current practice of releasing only state-level aggregates is not a technical constraint; it is a policy choice. Revisiting it, with appropriate firm-level confidentiality safeguards, is among the most tractable and high-return statistical reforms available.
The Finance Commission’s devolution formula already uses lagged, aggregate criteria such as income distance and population. A dynamic measure of structural trade position, tracking not just how poor a state is but how its productive capacity is evolving, could make fiscal redistribution more precisely targeted.
Nine crore records a month are being generated. The question is whether India builds the institutional will to read them.
Payal Seth is head of Center of Data for Economic Decision-making (CoDED) and lead economist. Ashish Kumar is president of CoDED, chief statistician at Pahle India Foundation, and former director general, MOSPI. Views are personal.
(Edited by Prasanna Bachchhav)
Move all sugarcane and rice farming to Bihar and Eastern UP, and procure all rice from Bihar and Bengal. That will generate lot of prosperity in these water-abundant regions.
At rhe same time, discouraging rice and sugarcane in Punjab and Vidarbha would reduce the debt problem.
Flood-prone areas of Bihar, should be converted into some Venice like cities.