


With the Election Commission announcing the final schedule for the 2019 elections, politicians are exhorting the Indian voters to show up at the polling booths on the election day to exercise their vote. Prime Minister Narendra Modi tweeted, “A high turnout augurs well for our democratic fabric.”
The festival of democracy, Elections are here.
I urge my fellow Indians to enrich the 2019 Lok Sabha elections with their active participation. I hope this election witnesses a historic turnout.
I particularly call upon first time voters to vote in record numbers.
— Chowkidar Narendra Modi (@narendramodi) 10 March 2019
India is known for a fairly high election turnout, but who turns out to vote in India, and why? In our last article, we discussed how constituency size, organisational networks, and social pressures may play a role in influencing voter turnout.
Two other factors are commonly cited as having an impact on turnout: literacy and urbanisation. Our findings suggest that the impact of overall education levels and urbanisation on voter turnout in India may be more nuanced than what political observers have traditionally believed.
Also read: Why voters don’t turn up in larger numbers in Lok Sabha elections – all politics is local
Literacy and turnout
What is the association between literacy and turnout in India? Survey data from the 2014 National Election Study conducted by Lokniti suggests that among the literate, the turnout among the college educated is lower than the turnout among the less educated.
However, there is virtually no difference in the turnout levels between the illiterate and the literate. Since the college-educated are less than 5 per cent of India’s population, lower levels of turnout among degree holders does not have much of an overall impact on the number of Indians who vote in every election.
Survey data does not take into account the milieu in which a respondent resides. In other words, it is not only the education of an individual, but the overall education level of an entire area that can influence who votes.
Research on turnout has shown that if my neighbour turns out to vote, I will as well (Green and Gerber. 2005. Get Out the Vote: How to Increase Voter Turnout. Brookings Institution Press). In areas where most people have an education, citizens may share a sense of responsibility towards their civic duties, including their duty to vote and the important role their votes play in the democratic process.
On the other hand, we may also expect a higher turnout in areas where few people are educated. The less educated are likely to be poorer and are hence more dependent on the state for their economic well-being. They are more incentivised to vote because their vote choice could make a greater impact on their lives.
Also read: This data shows why Indian MPs don’t truly represent their people
What data shows
What pattern do we find in the data? For this analysis, we looked at polling-booth level data culled from the Form 20 issued for each polling booth by the Election Commission of India and matched with the census data for the same location[1]. This allowed us to look at turnout in areas with very different literacy levels.
Figure 1: Association between the literacy level of the population of a village, town or city and polling-station level turnout in the 2014 Lok Sabha elections
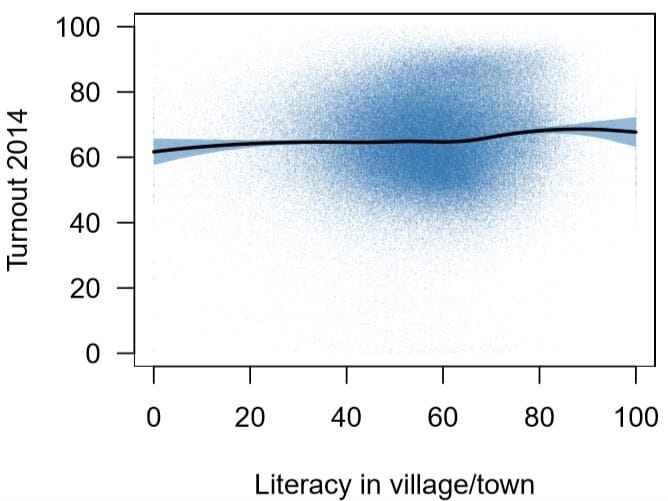
Figure 1 shows the association between the 2011 literacy levels (on the x-axis) of a village or a town and the corresponding polling-station level turnout (on the y-axis) during the 2014 Lok Sabha elections. This includes polling stations in about 2.85 lakh villages and towns from 11 Indian states.[2]
Each blue dot represents a particular polling station. The trend line shows the relation between literacy levels and the turnout when data from all the polling stations is aggregated. The trend line is more or less flat, indicating that turnout was similar in places with lower and higher literacy level.
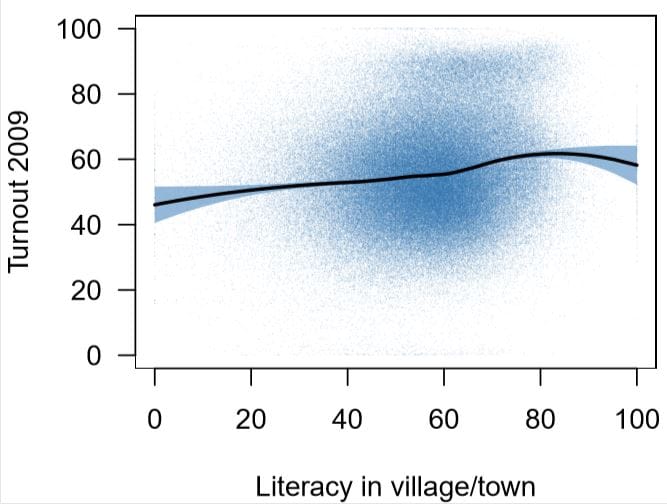
Similarly, in figure 2, we repeat this analysis for the 2009 Lok Sabha elections. Here, there is a small correlation, with turnout being somewhat higher in areas with high literacy levels.
Figure 2: Association between the literacy level of the population of a village, town or city and polling-station level turnout in the 2009 Lok Sabha elections
Also read: Do young dynasts appeal to new gen voters or are they also practising outdated politics?
Urbanisation and turnout
Another important observation often made about voting patterns in India is that voter turnout is lower in urban areas.
Similar to general understanding of the education-voter turnout relationship, the explanation often provided for higher turnout in rural areas is that voters in villages are more likely to be poorer than those in cities, and therefore more likely to be directly impacted by voting decisions.
The relatively wealthier urban voters are less dependent on the state for their economic well-being and hence have less incentive to show up at the polling station. But, does this apply to all urban areas or just the very large metropolitan areas? And how did it change in the 2014 elections?
Figure 3: Association between the size of the population of a village, town or city and polling-station level turnout in the 2009 and 2014 Lok Sabha elections
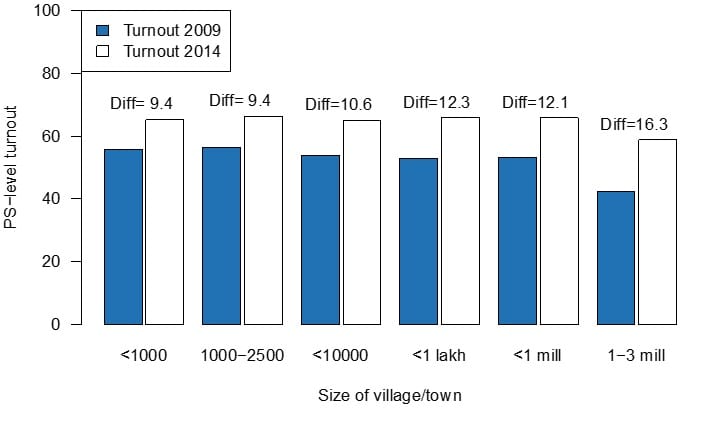
Once again, we look at data from polling stations from 11 states for the 2009 and 2014 Lok Sabha elections. Figure 3 shows the relationship between the size of the population of a village or a town (x-axis) and the corresponding polling station-level turnout (y-axis) during these elections. The dark blue bars represent the turnout during the 2009 elections and the light blue bars represent the turnout during the 2014 elections. Here, too, the data covers the polling booths of about 2.85 lakh villages and towns.
The bars on the extreme left of the horizontal axis show the turnout in villages with a population of less than 1,000 people, and those on the extreme right show turnout in cities with a population of more than 10 lakh. As can be seen in the figure, the turnout in the 2009 elections stood at approximately 56 per cent in villages with a population of up to 2,500. In larger villages and towns, the turnout was similar, at about 53 per cent. The big difference, however, was between the very large cities and the rest: in cities with a population of more than 10 lakh, the average turnout was only 42 per cent.
What happened in 2014?
In 2014, the turnout increased considerably across the board. The highest increase, however, was witnessed in large cities. In these elections, the average turnout was about 65 per cent across small and large villages and towns. The gap between the large metropolitan areas and the rest also shrank. In the cities with a population greater than 10 lakh, the turnout was 58 per cent. In other words, the very large cities still had a lower turnout than the rest, but the urban-rural divide was far less dramatic than what had been the case previously.
Also read: Ignorant voters and over-smart politicians: Why India votes the way it does
Devil in the data
While villages indeed see higher turnout than urban areas, it appears the real difference is arising from the far lower turnout in the largest metropolises, and not from most cities and towns. Similarly, while individual college graduates may turn out in lower numbers than their less-educated counterparts, more-educated areas seem to witness the same or higher turnout than less educated areas.
[1]These data were created for the book Constructing a Majority: A micro-level study of voting patterns in Indian elections by Jensenius, Chhibber and Alam (forthcoming, Cambridge University Press)
[2]The eleven states are Andhra Pradesh, Bihar, Gujarat, Himachal Pradesh, Jharkhand, Madhya Pradesh, Punjab, Rajasthan, Uttarakhand, Uttar Pradesh, and West Bengal.
Pradeep Chhibber is with the University of California, Berkeley. Francesca Jensenius teaches at the University of Oslo. Harsh Shah, an alumnus of the University of California, Berkeley, is a political analyst and works in the private sector.
This is the third in a series of articles in ThePrint that will provide readers with comprehensive, research-based information about the Indian elections since 1962. The articles will also draw upon recent findings from Constructing a Majority: A micro-level study of voting patterns in Indian elections (forthcoming Cambridge University Press) by Francesca Jensenius, Pradeep Chhibber, and Sanjeer Alam. Read the first article here and the second article here.
People dislike EVM system of voting so they quit voting during elections. Govt.should restart ballot voting system as EVM is highly manipulated by ruling political parties. Parliament should have people’s representatives to make new laws not the EVM representatives.