


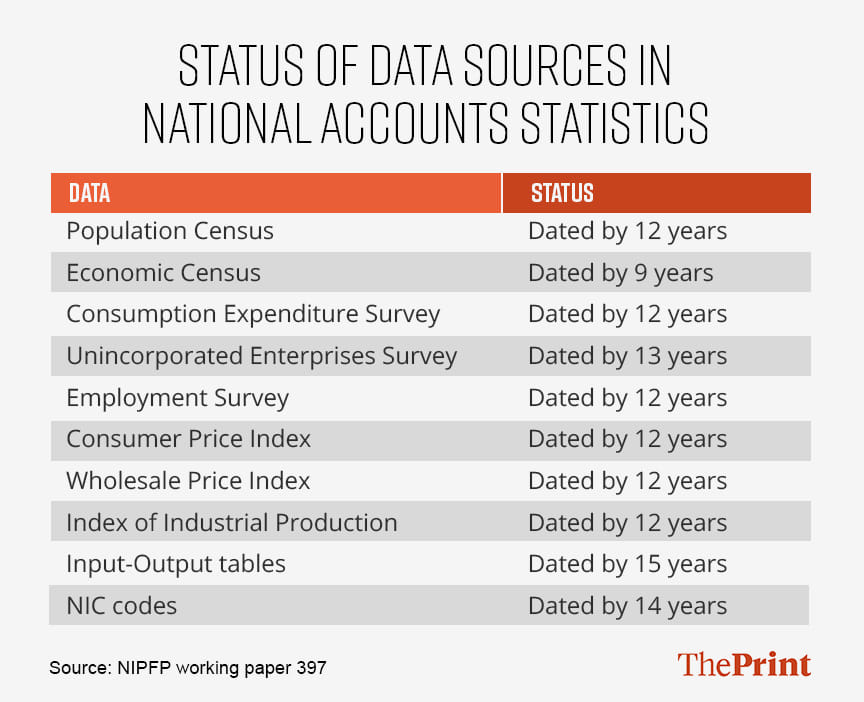
The next time somebody, even the Prime Minister, boasts about India being the fastest-growing economy or that it is the fifth largest in the world, ask them to prove it. Even Modi will not be able to. The reams of government data that will be thrown at you will almost all be incorrect, and the analysis done on them will be guesswork at best. The reason for this is not some convoluted statistical reasoning. It’s much simpler: the data is outdated and largely meaningless. The most recent actual data for the Indian economy we have is about 12 years old.
Amrit Kaal may be the target, but we don’t even know our starting point.
The old…
Let’s take something as conceptually simple as per capita gross domestic product (GDP)—basically the total output of the country divided by the population. It serves as a broad proxy to denote the wealth of an average Indian. Should be simple enough to calculate, right? Let’s start with the numerator, which is the GDP figure.
The agriculture sector probably has the most up-to-date data when it comes to the overall GDP measure, and even that comes with a delay of about two years. The Directorate of Economics and Statistics in the Ministry of Agriculture and Farmers Welfare compiles the data on India’s agriculture output for any given year, and releases four advance estimates, before the final figures come out about two years after the collection.
Such a ‘short’ delay of just two years might have been okay if agriculture formed a larger part of our GDP. But with a share of less than 20 per cent, accuracy of agricultural data, while important, doesn’t materially improve the quality of the overall GDP number.
From here, it just becomes worse.
The manufacturing sector is divided into the organised sector and the unorganised sector. Data for the organised sector used to come from the Annual Survey of Industries—but with a lag. Now it comes from the much more up-to-date MCA-21 database compiled by the Ministry of Corporate Affairs. That’s not the problem here. The unorganised sector is.
The unorganised or informal sector, by definition, is difficult to quantify because there are no formal metrics through which such an audit can take place. If you could effectively measure it, it would not be ‘unorganised’ or ‘informal’. Rather, it is ‘unorganised’ because you can’t measure it.
Policymakers have gotten around this problem by periodically doing a nation-wide survey. Using the findings of the survey of the informal sector, the statisticians in the government then arrive at a ratio that can neatly be multiplied by the size of the formal sector, to arrive at an approximation of the size of the informal economy.
So, let’s say the formal sector is Rs 100 in size, and the ratio they have arrived at is 1.25. The informal sector would then be estimated at Rs 125 (Rs 100 x 1.25), which then gives you the total economic output of the sectors being measured—Rs 225 (Rs 100 + 125).
Ideally, this would work well. However, at a time when the latest survey of the informal sector—the Unincorporated Enterprises Survey—is from about 13 years ago, well before demonetisation, GST, and Covid, we don’t really know what shape the informal sector is in right now.
Then we come to the services. Trade, hotels, restaurants, real estate, all have significant contributions to GDP and sizeable informal segments, all of which are based on surveys conducted in 2011-12 or thereabouts.
Just think about the sea change the Indian economy has witnessed since 2011—both the positive and the negative. Inequality has widened, but access to basic essentials has improved. Demonetisation wiped out 86 per cent of the cash in the system overnight. The indirect tax system was overhauled with GST. A pandemic disrupted the economy like never before.
And then there are the myriad smaller changes that over time become big. The movie theatre industry has changed so dramatically. An entire generation of entrepreneurs are minting money by creating two-minute videos, forget any sort of asset creation. None of these or the million other changes to the Indian economy over the last decade are being captured in the data.
So that’s the numerator of the per capita GDP formula—almost every aspect of it is outdated. The denominator is the population of India, measured by the Census of India. When was the latest one? You guessed it, 12 years ago!
Also read: ‘Muslim kids at RSS shakhas, Hindus played at mosque’—Gyanvapi now a saga of who prayed where
…and the uncaptured
So, if the GDP number as well as the population size are both more than a decade old, then when somebody talks about the size of the economy or per capita income, what are they talking about? It’s not the present, for sure.
Our data issues don’t end there. The other big number on everybody’s mind is inflation. As this analysis shows, the Consumer Price Index—which is what the Reserve Bank of India uses to measure inflation—falls woefully short of truly measuring the impact of rising prices on the people. The weightage for food is too high, while that of fuel and services such as health, education, and transport and communication are too low.
So, you have a situation where the overall inflation rate gets affected by a change in the price of wheat, even though 80 crore Indians currently get it for free. Or you have a situation where fuel prices shoot up in response to global oil prices, but the overall inflation rate barely registers it. And, while the middle class increasingly prefers private hospitals and private schools (don’t forget tuition classes), this increased spending on health and education is not getting captured.
In fact, with the latest usable Household Consumption Expenditure Survey being only available for the year 2011-12, we actually have only a vague idea about how people are spending their money and how much they are earning.
It’s fine for developed countries like the US to not update their CPI for around 40 years—though even there it might be time for a revision—because the rate of change of these basic economic indicators is much lower there than in an emerging economy like India. Here, a decade is a long time, and a lot can change during it.
It’s not just these, though. Several lesser-known but key surveys that underpin the very basic estimates we have of the economy haven’t been updated in years. The Economic Census is nine years old, the employment survey is 12 years old, as is the base year of the Index of Industrial Production. The input-output tables, critical to measuring the relationship between the production and use of various items in the economy, are 15 years too old.
The government can say all it wants about Amrit Kaal arriving and India becoming a developed nation by 2047, but if it wants to seriously achieve this trajectory, it is first going to have to establish where we stand now.
Views are personal.
Eye-opening