Bengaluru: Numbers are essential to any sport, and cricket fans especially like to throw them around to make their point, show off their knowledge and acknowledge the greatness of legends — from Sir Donald Bradman’s average of 99.94 to Sachin Tendulkar’s 100 international centuries and Muttiah Muralitharan’s 800 Test wickets.
Given cricket’s multiple formats and mushrooming national leagues, there have been increasing discussions to move beyond the traditional measurement systems. And now, ESPNCricinfo and IIT-Madras have got together to launch a new kind of scoring metric called Superstats, which uses data science for analysis.
The idea is to take into consideration factors that the traditional metrics like economy rate, average and strike rate don’t take into account — context, game situation, etc. For example, these new stats will give different weightage to a century under pressure against high-quality opponents than one while batting first against an associate nation. They will also, for the first time, take into account the element of luck, such as dropped catches or incorrect umpiring decisions.
“The development of these new metrics filled a long-felt gap in evaluating cricket performances,” said Sambit Bal, editor-in-chief of ESPNCricinfo. “We have combined big data, cricket intelligence, and also data science to produce a set of numbers that will help fans understand and appreciate the game better.”
At the launch of Superstats, India’s legendary batsman and current Under-19 and India ‘A’ coach Rahul Dravid said: “The critical thing for me are the people who are going to make the best use of these numbers — how you read those numbers, what you get out of these numbers is the key.”
What is Superstats?
Superstats was originally launched in 2018 as a standalone tool for fans to judge performances in T20s, but is now utilised for number-driven metrics.
The AI-powered algorithm combs meticulously through over 10 years of ball-by-ball data, and takes into consideration three new parameters: Luck index, forecaster, and smart stats. It also utilises new metrics like smart wickets, player quality index, and pressure indices.
The algorithm processes fast incoming data, quantifies the impact of luck, and analyses the real value of a player’s performance in the game of cricket in real time. It was developed by researchers from IIT-Madras and Gyan Data Pvt Ltd, a company incubated by the institution, in partnership with cricket experts from ESPNCricinfo.
Under this umbrella come three sets of metrics — Luck Index, Forecaster and Smart Stats.
Also read: Shakti: IIT-Madras develops India’s first indigenous microprocessor
Luck Index
The most interesting new aspect to Superstats is the Luck Index which, for the first time, quantifies the element of chance in a game.
“While there might be many interpretations for luck, these algorithms rationalise and consistently quantify luck events so that a whole tournament with matches that occurred in disparate circumstances could be compared in an ‘apples-to-apples’ fashion,” said Raghunathan Rengaswamy of the department of chemical engineering who, along with Mahesh Panchagnula of IIT-Madras, led the project.
Luck Index identifies events that are considered to be ‘lucky’. These are of two types — dismissal-related, and non-dismissal related. Some dismissal-related events that fall under the luck quantifier are events like a dropped catch, a batsman wrongly given out by the umpire, a missed stumping, etc. Non-dismissal events are where the batsman getting out is not in the picture, like overthrows, no-balls, injuries, etc.
To quantify the luck, the Luck Index model of the algorithm performs a simulation where the lucky event is replaced with the opposite of it and the game continues. Depending on the extent to which it alters the match, the events are weighted. Dismissal events are weighted higher, and if that event caused the match to have a completely different outcome, it is weighted even higher.
Speaking on the element of luck, Dravid recalled: “Luck played a huge role in my career in 2009. I was on the verge of being dropped and was given an extra opportunity in Mohali against England. I was batting at number 3 and Stuart Broad bounced me. It was a top edge and as soon as I hit it, I was ‘oh god, I’m out again’.
“It just fell (short) of Matt Prior and the fine-leg fielder running in. I got a hundred in that game and went on to have a couple of good years, including three hundreds in England.”
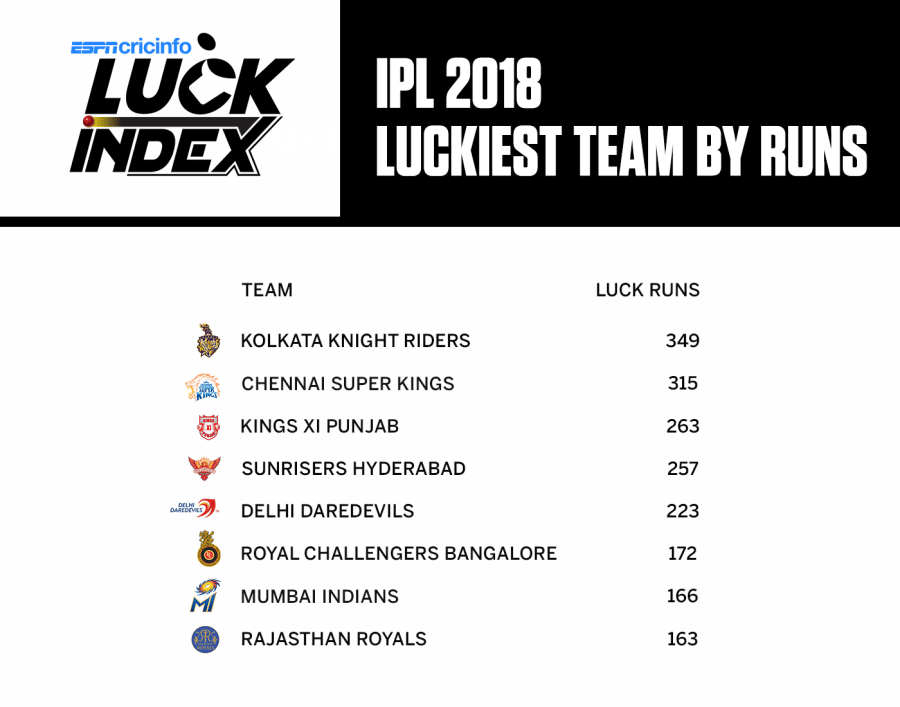
When run on IPL 2018 data, the algorithm threw up Kolkata Knight Riders as the luckiest team with 349 ‘Luck Runs’. Shane Watson was the luckiest batsman while Aaron Finch was the unluckiest. Rashid Khan was the unluckiest bowler.
A catch dropped by Vijay Shankar in the match between SunRisers Hyderabad and Delhi Daredevils when Hyderabad required 31 from 15 balls was the most impactful event in IPL 2018, the researchers said.
Also read: Severing cricketing ties with nations not our domain, ICC tells BCCI
Forecaster
This tool, as its name suggests, performs forecasts and predicts outcomes of a match. It gives the winning probability of a team, the expected final total for the team batting first, and the expected runs and wicket probabilities for each bowler for the next over of an innings. It also predicts the runs and wicket probability in the next over.
It takes into account four factors: The batting strength of the team, the bowling strength of the opposition, batsman-bowler combination numbers, and phase-wise strike and economy rates for batsmen and bowlers. This provides an ‘expected score’ for batting, also taking into consideration team momentum (runs and wickets in the last over) and historic data of teams winning in this position.
The forecaster claims to have a 60 per cent success rate in predicting the winning team at the start of the run-chase, and an improved 80 per cent success rate after 15 overs. The prediction is dependent on the quality of players as well, and on the head-to-head combinations of different batsmen and bowlers.
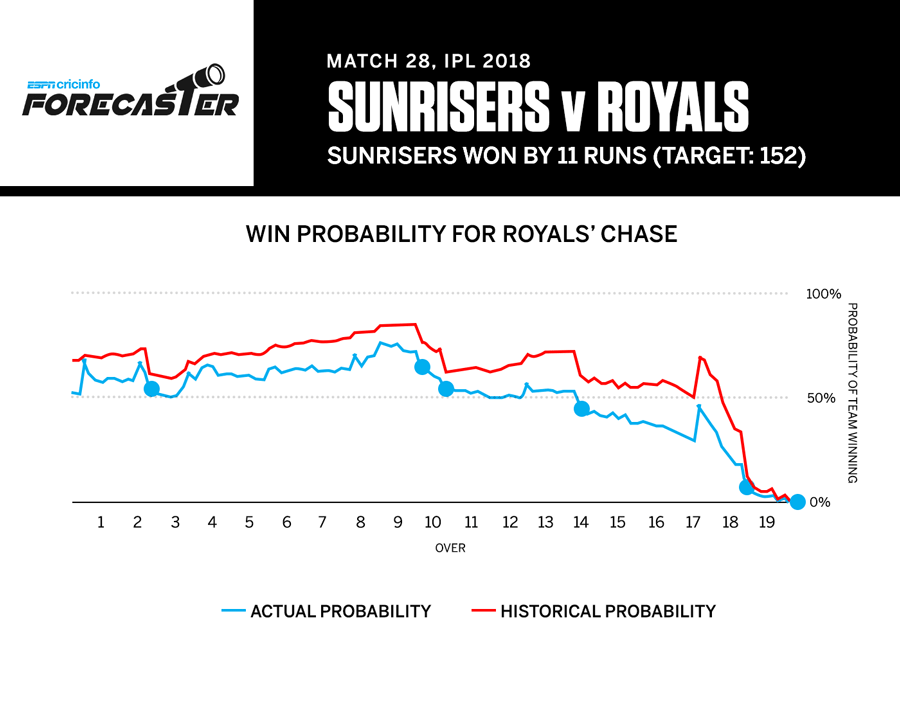
Processing data for the IPL 2018 match between Rajasthan Royals and SunRisers Hyderabad, for example, at a point where Royals needed 50 runs from 30 balls with six wickets in hand (an easy enough T20 run-chase), the tool predicted a 41 per cent chance of them winning. The probability was so low because the Royals had lost all of their best batsmen — they actually went on to lose the match by 11 runs.
Smart Stats
This is a contextual scoring system, which takes into consideration external parameters like pitch conditions, pressure on players, quality of opponents, and more. All these factors, once evaluated and quantified, measures the true value of each individual’s performance on the pitch.
This algorithm gives value to each run that is scored and every wicket that is taken by examining the batsmen-bowler combination metric, required run rate, and the quality of the subsequent players to come. It then gives out six smart metrics: Runs, wickets, strike rate, economy rate, contribution, and player quality.
Smart runs consider the pressure the batsmen were under when the innings was played. Twenty runs could be worth 30 or 40, depending on those factors. Smart wickets, similarly, consider the quality of batsman, at what point he was dismissed (early/late), match balance, etc.
Smart contribution is the actual contribution made by a player in a match. The batting and bowling stats are taken into account against the team’s position. Bowler’s wickets are converted to a run value for comparison for calculation over 100. Poor performance earns a player a negative score.
Player quality is calculated by combining smart values for batting and bowling over a period of time.
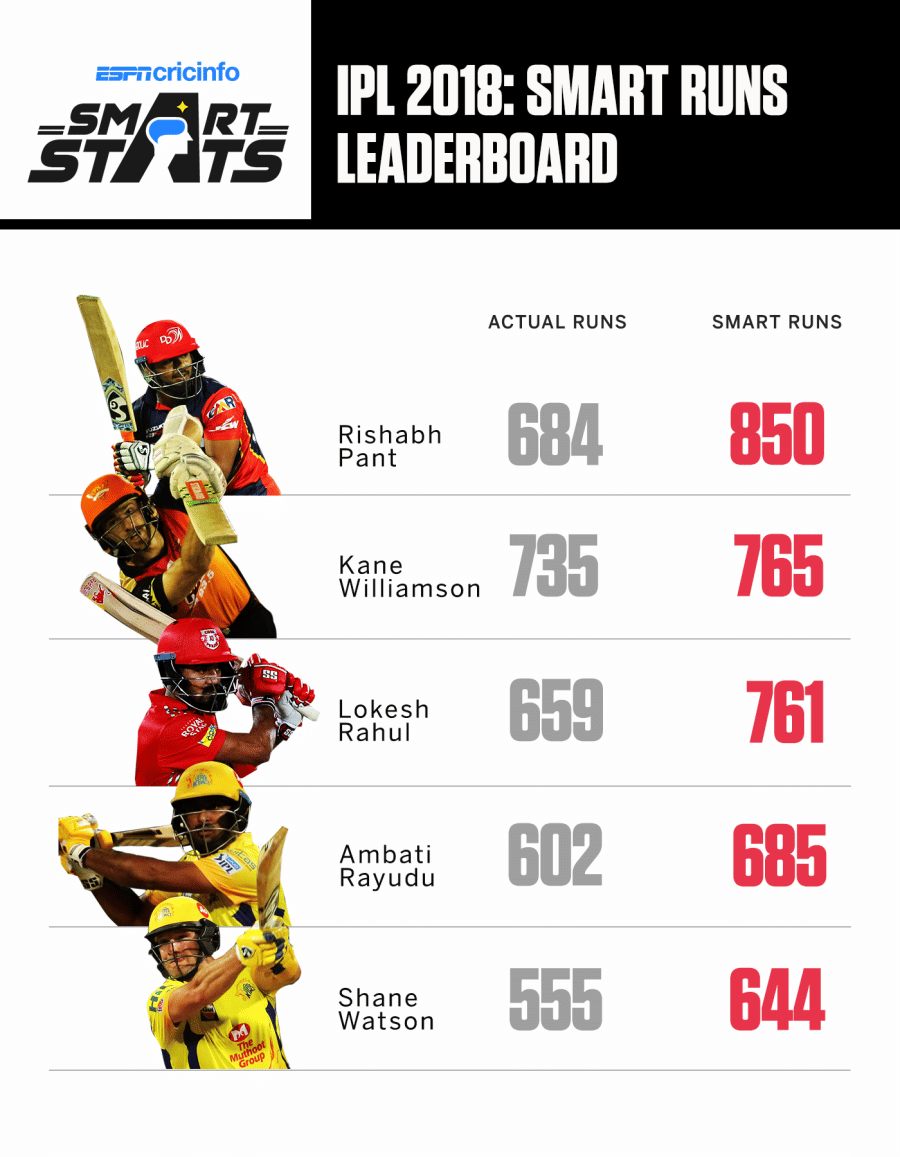
When run on IPL 2018 data, Smart Stats predicted Rishabh Pant as the Orange Cap holder and Rashid Khan as the Purple Cap holder. The actual awards went to Kane Williamson and Andrew Tye, who were both second behind Pant and Khan according to Smart Stats. It also predicted Sunil Narine as the most impactful player of IPL 2018.
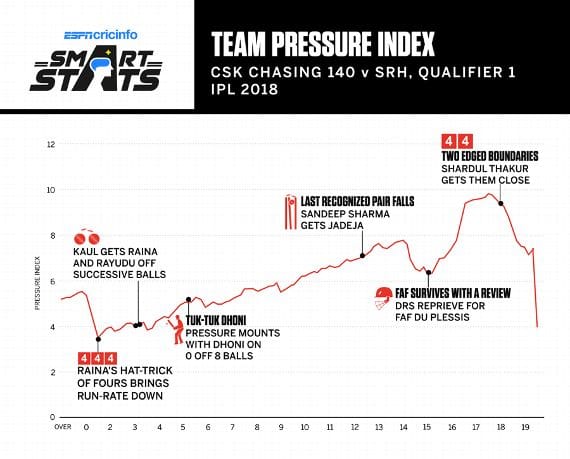
Pressure Index
One of the primary parameters to calculate smart numbers well is the Pressure Index. This determines the quality of runs scored and thus their value as well. For every ball, the Pressure Index algorithm quantifies the amount of pressure on a batsman between values of 0 and 10. Runs scored off each ball are weighted based on the Pressure Index value on that ball. As a result, runs scored in high-pressure situations will be worth more than otherwise.