


Any visit to a temple town in South India shows the thronging and thriving of various economic activities. From manufacture and sale of items of faith to markets of unique traditional artefacts and handicrafts, such temple towns are resplendent with hustle and bustle of buyers and sellers swarming the streets. Apart from attracting pilgrims and tourists, these towns also play a critical role in their district’s economy.
In this article, we look at the economies of the four most important temple districts of Uttar Pradesh–Ayodhya (Faizabad), Gorakhpur, Mathura, and Varanasi. Three of these— except Mathura—fall in the Poorvanchal region of the state. We focus on the relative importance of these districts in their respective regions and how has it changed in recent years. We also look at the contribution of various sectors of these districts in the region’s economy, and how it has changed in the previous decade.
Four temple districts of UP
Ayodhya is widely believed to be the birthplace of Lord Ram (Ram Janmbhoomi). The Faizabad district, of which Ayodhya city is a part, was renamed Ayodhya in November 2018. Mathura, on the other hand, is regarded as the birthplace of Lord Krishna. The district houses the twin cities of Mathura and Vrindavan and is often referred to as Brijbhoomi (land of Krishna). Varanasi is famous for its long-established association with Lord Shiva. Kashi-Vishwanath temple in the district houses one of the 12 jyotirlings of Lord Shiva. It is the oldest continually inhabited city in the world. Gorakhpur is a well-known seat of the Gorakhnath (another name for Lord Shiva) Math.
The political importance of the temple district in UP cannot be overstated in the region or the Indian context. Prime Minister Narendra Modi himself represents the Varanasi Lok Sabha constituency. The incumbent chief minister, Yogi Adityanath, was a long-serving MP from the Gorakhpur seat (since 1988). After being chosen as the chief minister, he had to resign from this Lok Sabha seat. He is currently a Member of the Legislative Council (MLC). In the ongoing election, he is contesting from the Gorakhpur (Urban) assembly constituency. The politics of the ruling party in the state—BJP—has been centred on building a grand Ram temple at Ayodhya.
Also read: CM says UP will be largest economy if BJP wins. Data shows unlikely for a decade or two
Our data and method
We employ data from the District Domestic Product (DDP) from 2011-12 to 2019-20 at current prices. The data for one intervening year (2018-19) is not readily available, so we interpolate data for this year. We use Gross Domestic Value Added (GDVA) to measure a district’s economy.
As UP is extremely diverse—both geographically and economically—it may be prudent to compare the districts with their respective regions, rather than the economy of the whole state. We compare three of the four districts—Ayodhya, Gorakhpur, and Varanasi—with the eastern region (comprising 28 districts) in which they fall. We compare Mathura with the western region (comprising 30 districts). Additionally, we take the contribution of various sectors, and sub-sectors from these districts vis-à-vis the entire region. In addition to the primary sector (agriculture and allied sectors), we look at the contribution of manufacturing, construction, and trade, hotels and restaurants.
Also read: Yogi is Baba, Mahant, or Gorakhnath. Akhilesh’s image is all about ‘change with continuity’
The economy of eastern UP
Where does the eastern region, constituting 28 districts, stand in relation to the whole state? In Figure-1, we plot the Gross District Value Added (GDVA) of the district in proportion to the state. In addition, we also plot the shares of five sectors of the economy: Agriculture and allied sectors; manufacturing; construction; trade, hotels and restaurants; real estate and ownership of dwellings and professional services. It may be pertinent to note that the 28 districts of the eastern region contribute to 40 per cent of the state’s population.
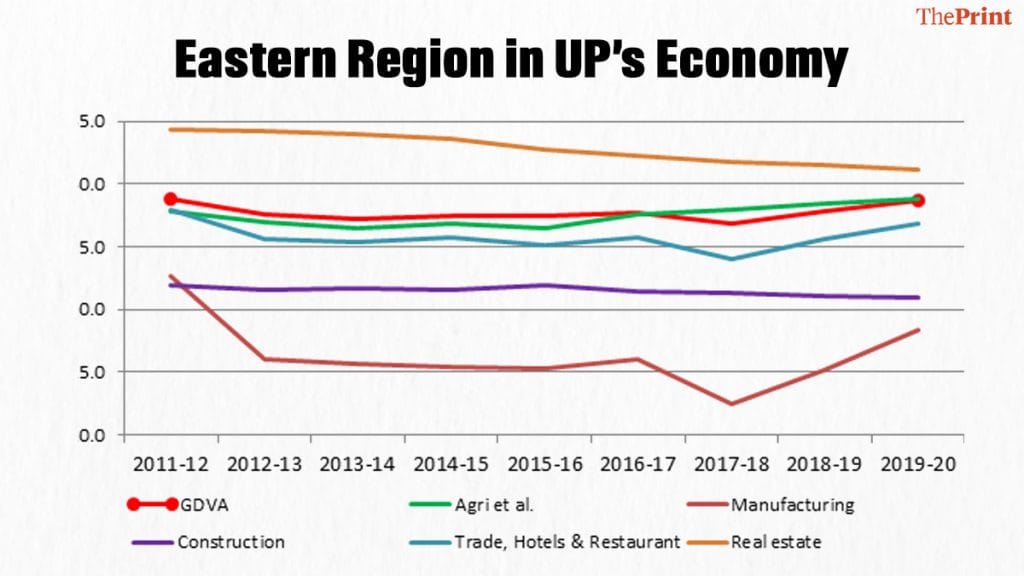
The economy of the region has been less than a third of the state (28.8 per cent and 28.6 per cent in 2011-12 and 2019-20 respectively. The agricultural sector is more or less in line with this trend. This may appear counter-intuitive to the usually held belief that eastern UP is predominantly agrarian. What Figure-1 shows is the agricultural output of the eastern region compared to that of the whole state. The contribution of agriculture from the western region to the state’s agriculture sector is higher. In 2011-12, agricultural output from the western region was 1.8 times that of the eastern regions. This declined to 1.6 times in 2019-20.
The manufacturing sector is significantly lower in its share and hovered just above 15 per cent during the early years of the previous decade. There was a steep decline in 2017-18, after which it has touched 18.4 per cent in 2019-20. This may have been on account of the boost given to manufacturing in the region. What led to the dip in 2017-18 and a subsequent revival in the last two years requires further investigation. The share of the construction sector in the eastern region has stayed in the range of 21-22 per cent over the years. Trade, hotels and restaurants, an important constituent of the services sector, shows a trend similar to manufacturing, even though the proportion they contribute to the state’s economy is significantly different. The real estate and professional services sector has been seeing a decline since the mid-2010s.
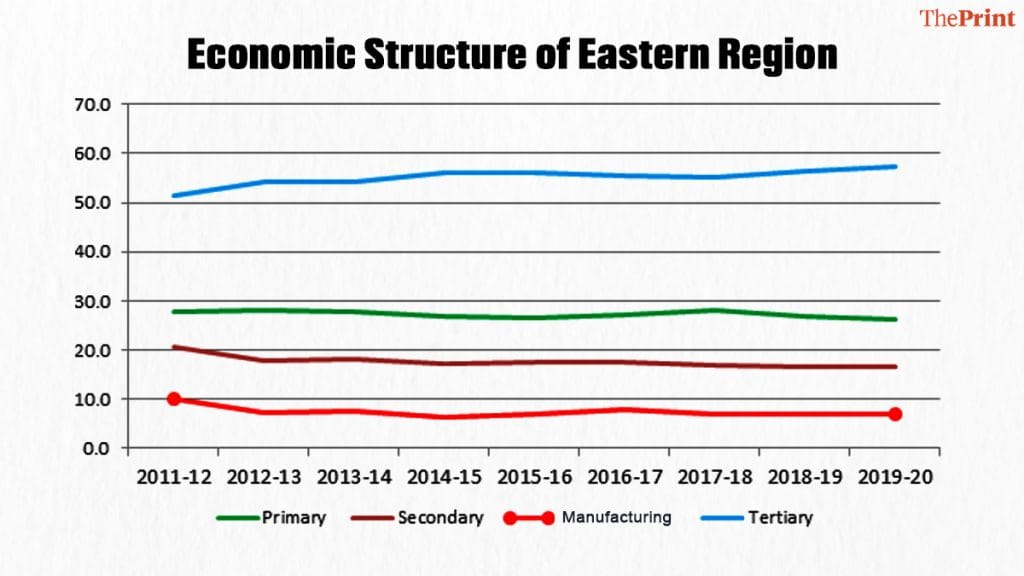
In Figure-2, we look at the contribution of various sectors in the eastern region’s economy. The first thing to notice is that the services (or tertiary) sector is the leading sector in the economy. Its contribution to the region has been increasing, slowly but steadily, over the years. This trend is in line with the state’s as well as India’s economy. Second, the contribution of the secondary sector (manufacturing, construction, and utilities) leaves much to be desired. Its share, too, has shown slow but steady decline over the past decade. Third, the most precarious condition seems to be that of the manufacturing sector. This important sector contributes to less than a tenth of the region’s economy. In 2019-20, it stood at an abysmal low of just 6.9 per cent. Finally, the contribution of agricultural sector has remained roughly constant over the years. In fact, it declined slightly from 28 per cent in 2017-18 to just 26.2 per cent in 2019-20.
To sum up, there does not appear to be any structural change in the economies of the eastern region in the previous decade. We now shift our focus to the four temple districts in UP.
Also read: From Ayodhya to Kashi, BJP changed its strategy from ‘demolition’ to construction
Economy of the temple districts
We plot shares of the four districts in the economy of their respective regions in Figure-3. The denominator for Ayodhya, Gorakhpur and Varanasi is the eastern region, whereas the denominator for Mathura is the western region. We observe some important changes happening in these districts.
First, the contribution of Gorakhpur in the eastern region’s economy has been consistently increasing over the previous decade – from just 5 per cent in 2012-13 to 6.9 per cent in 2019-20, in less than a decade. The district may very well emerge as an important growth centre in an economically backwater region of the country.
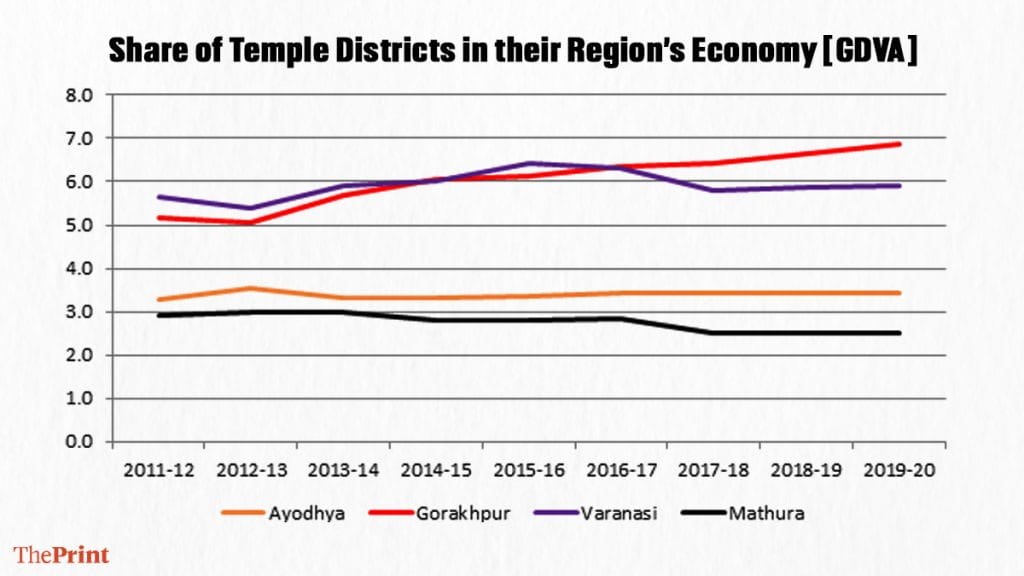
The economies of the other three districts do not show such optimistic changes. Varanasi saw some positive changes during 2013-16, during which its share in the regional economy increased from 5.4 per cent (in 2012-13) to 6.4 per cent (in 2015-16), after which it declined to its earlier level. Since 2017-18, the district’s share has been constant. The contribution of Ayodhya in the region’s economy has remained roughly constant around 3.3 per cent over most of the last decade.
The share of Mathura in western UP’s economy was 2.9 per cent in 2011-12, which has come down to just 2.5 per cent in 2019-20. It may not be incorrect to observe that the district is losing its economic prominence in the region. In the interest of comparability, it may be worthwhile to reiterate that this share is with western UP, the economically dominant region of the state. One of the districts in the region is NOIDA, which has grown significantly in the last two decades. In absolute terms of economic size, Mathura is closer to Varanasi. In 2012-13, their economies were roughly of the same size (about Rs 11.6 thousand crore in current prices). In 2019-20, the district was just about three-fourths the economic size of Varanasi.
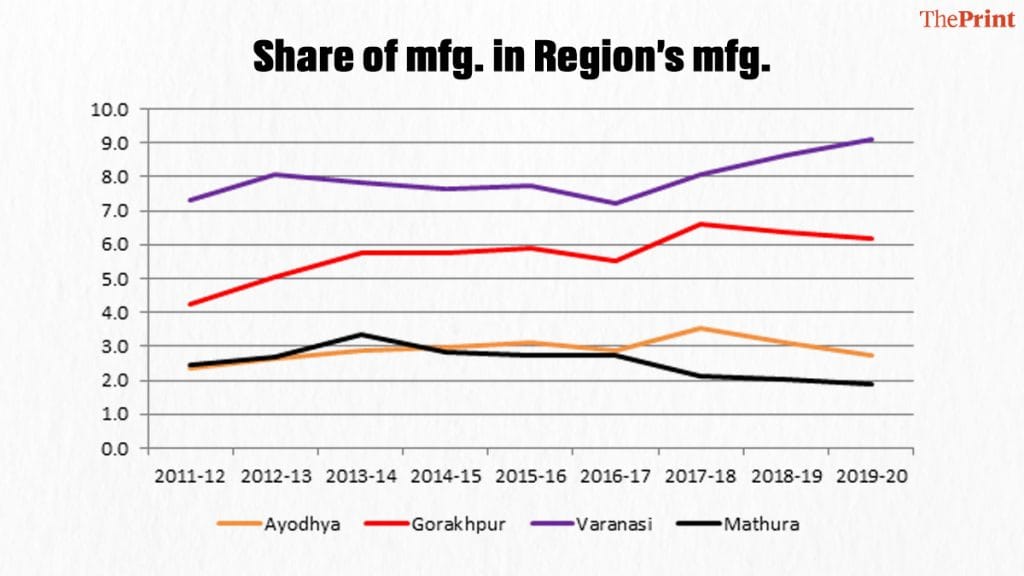
We plot the shares of manufacturing sector of these districts in Figure-4. The share of Varanasi is the highest among the four districts here. Interestingly, this share has been rising since 2016-17. Which industries contributed to this steep rise needs further investigation. In 2019-20, Varanasi’s manufacturing sector contributed 9.1 per cent of the region’s total output. Gorakhpur also saw a steep rise in the early 2010s, then it stagnated. But overall, it shows a positive trend. The manufacturing sector of Ayodhya does not seem to be of much significance and has hovered at around 3 per cent. The relative importance of Mathura, on the other hand, has slowly declined. Its share in the western region has declined steeply from 3.3 per cent (in 2013-14) to just 1.9 per cent (in 2019-20).
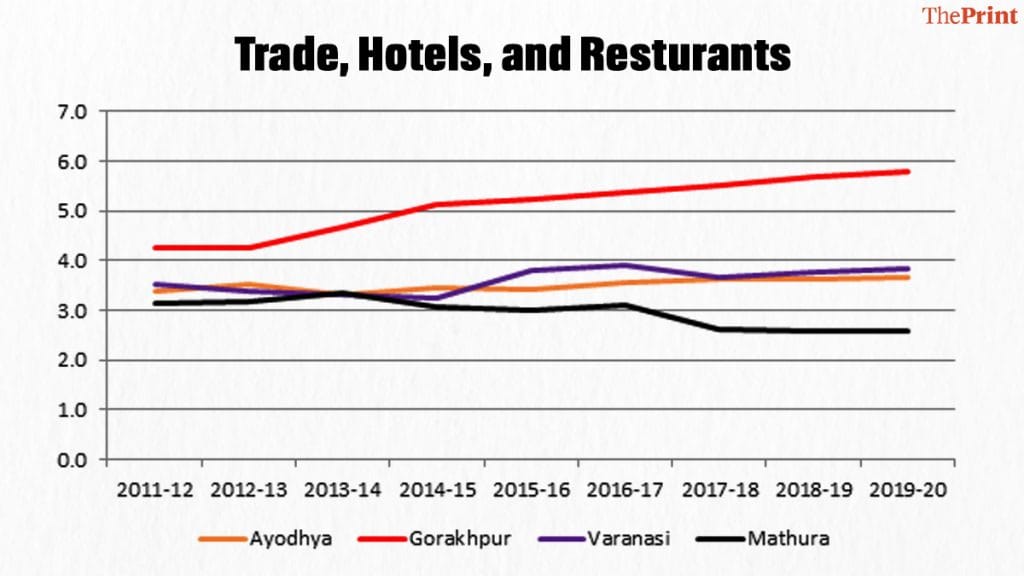
We undertook a similar analysis for three other sectors: Construction, real estate & professional services, and trade, hotels & restaurants. In the interest of space, we discuss only the last of the three sectors here (Figure-5). Here again, Gorakhpur emerges as a huge gainer. Its share has increased from just 4.2 per cent (2011-12) to 5.8 per cent (2019-20). This story also seems to be in line with the construction sector and real estate & professional sector’s contribution (not shown in graph). The share of Ayodhya is more or less stagnant, whereas the share of Mathura has declined slowly over the last decade.
Also read: Jobs or moksha? Modi’s Kashi corridor in Varanasi comes at a price
Conclusion
The areas in and around a temple are generally a small part of the entire district. It may not be appropriate to attach a lot of economic importance to them. This is especially so in a short span of time. With this caveat in the backdrop, we looked at the economies of the four most prominent temple districts of Uttar Pradesh. We found some interesting changes happening.
Gorakhpur appears to be fast emerging as an important district in the eastern region. The manufacturing sector in Varanasi seems to be gaining some ground. With the coming of the highways, these two districts, especially Gorakhpur, may be groomed to become a regional growth centre. Despite political prominence, Ayodhya seems to be economically stagnant. Mathura, on the other hand, seems to have slowly lost its economic importance in the previous decade.
Vikash Vaibhav is Assistant Professor at Dr. B.R. Ambedkar School of Economics (BASE), Bengaluru. He tweets @VikashVikashv. Akhilesh K. Verma is a research fellow, Economic and Social Research Institute (ESRI), Dublin, Ireland. He tweets @AkhileshV_. Views are personal.
This article is part of the ‘UP in numbers’ series. Read all the articles here.
(Edited by Neera Majumdar)