


The importance of the Uttar Pradesh assembly election, scheduled to last about a month beginning 10 February, cannot be overemphasised. It is being regarded as the fore-runner of the 2024 Lok Sabha election. As such, there have been a lot of claims made by the incumbent Uttar Pradesh government, chief among which is related to the state’s economy. In the politically charged climate, the state government is projecting Uttar Pradesh’s economy as one of the fastest growing, asserting its ‘potential’ to become India’s largest in the not-so-distant future if it wins the 2022 assembly election.
A careful look at the number is warranted, and we attempt to do exactly that in this article. We look at Uttar Pradesh in terms of its aggregate economy, per capita income, and growth of various sectors, especially the manufacturing sector. In the process, we assess if the claims made by the current government are feasible.
Data and method
We took the data for Gross State Domestic Product (GSDP) at constant prices (2004-05 and 2011-12 series) from EPW Research Foundation (India Time Series). The 2019-20 data is quick estimates whereas the 2018-19 data is provisional estimates. The earlier ones are the final estimates. A comparable data for the Gross District Domestic Products (GDDP) — provided by the Uttar Pradesh Directorate of Economics and Statistics (DES) — is available only from 2011-12. We chose 2019-20 as the terminal year on account of the Covid-19 pandemic, which severely impacted the economy in the wake of the lockdown imposed in the last week of March 2020.
Also read: Unemployment rise in India isn’t due to Covid alone. See what data says
Large economy, low per capita Income
How does the economy of Uttar Pradesh compare with other major Indian states? We plot five largest economies of India relative to the size of UP’s economy, normalised as 100 (Figure 1). The horizontal line at 100 denotes Uttar Pradesh. The first thing to note is that Maharashtra is the largest Indian economy, roughly 1.8 times that of UP since last one decade. All other four states — Andhra Pradesh (including Telangana), Karnataka, Gujarat, and Tamil Nadu — had economies smaller than that of UP as late as 2009-10. Three of these four have surpassed the size of UP’s economy. Karnataka, too, is likely to surpass UP in just a few years, because of its relatively higher growth rate.
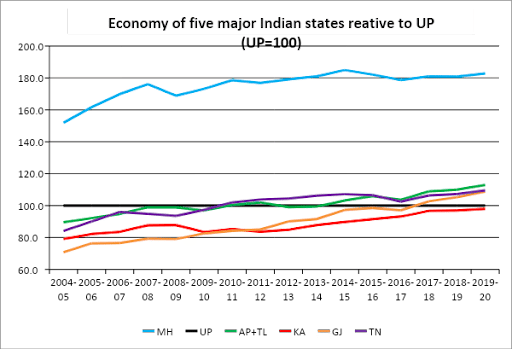
This simple graph makes a few important points. First, these five states are in the western or southern part of India. Second, the gap between Maharashtra and other bigger economies is huge and is unlikely to be bridged anytime soon. Third, the slope of each of these five economies is positive, suggesting that their growth has been faster than that of UP. Thus, the government’s claim of making UP India’s largest economy may not happen for a decade or two.
We plot the per capita income of UP with other poor Indian states (Figure 2). A popular acronym — BIMAROU using the initials of Bihar, Madhya Pradesh, Rajasthan, Odisha, and Uttar Pradesh — is often used to club these states. On the vertical axis, we have per capita income at 2011-12 constant prices (in Rs hundreds). Even though UP’s economy is among the largest in India, its per capita income — a crude measure of people’s well-being — is among the lowest across major Indian states.
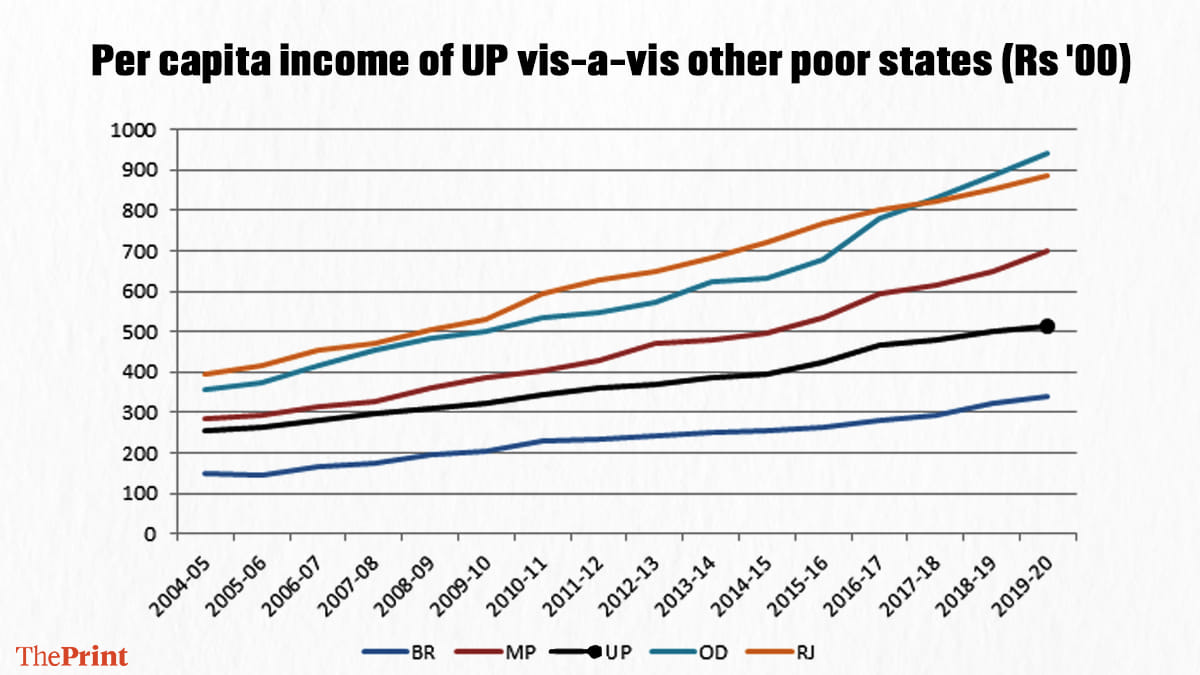
This is on account of UP’s large population — comparable to that of Brazil, Pakistan, and Bangladesh. According to the 2011 Census, the population of UP was about 199.8 million (16.5 per cent of India). On the other hand, Maharashtra comes a distant second with 112.4 million (9.3 per cent of India).
A few points may be noted here. First, the per capita income of UP is slightly more than Bihar’s, and lower than that of other three states. Second, Odisha has recently overtaken Rajasthan to emerge as the leader in this club. Third, the relative positions of these five states have remained the same over a decade and a half. The absolute gap only appears to be widening. Finally, the trajectory of UP does not show any dramatic change since the incumbent government came to power in March 2017.
Also read: Let them eat communalism: Yogi’s poll pitch may work but heartland’s jobless fury endangers India
The curious case of manufacturing sector
Let’s focus now on various sectors and compare the growth of Uttar Pradesh vis-à-vis the previous governments in the state. The economy of UP is well diversified. In 2019-20, agriculture and allied activities contributed 20.6 per cent, industry 29.2 per cent, and the rest was accounted for by the services sector. The manufacturing output — a sub-sector that comes under the head of industry — was 14.2 per cent of UP’s economy.
We compute the compound annual growth rate (CAGR) for various important sectors for the last two state governments (Table 1). The growth of UP’s economy during 2017-20 is just 4.9 per cent, a full two percentage points less than during 2012-17 period (6.9 per cent).
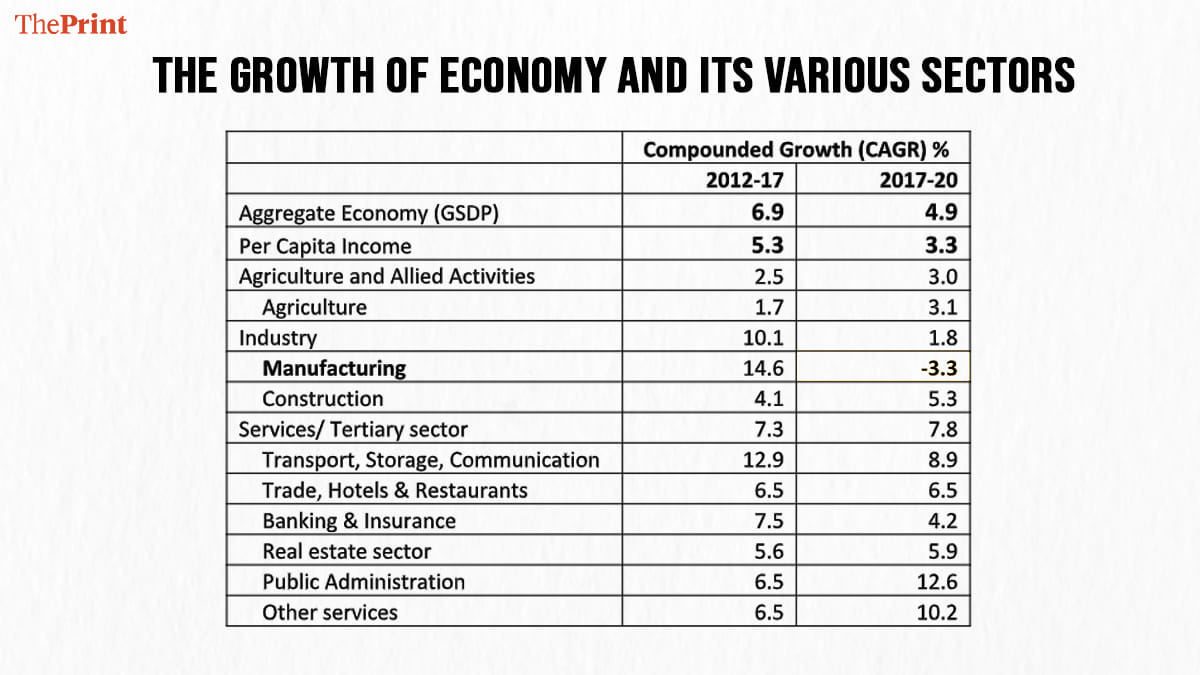
How do various sectors compare? The growth in agriculture and allied activities (3 per cent compared to 2.5 per cent) and services sector (7.8 per cent compared to 7.3 per cent) has been marginally better in the first three years of the Yogi Adityanath government compared to the previous Samajwadi Party government led by Akhilesh Yadav.
However, the most striking feature in this table is the performance of the manufacturing sector, which saw a decline during 2017-20 (-3.3 per cent). This is quite in contrast with the previous government, where manufacturing was the best performing sector (14.6 per cent). This figure has also been confirmed elsewhere. This poor performance is despite the focus on ‘Make in India’, which was expected to benefit the ‘double engine’ government of the state. The employment conditions, especially for the youth, have worsened in the state.
Also read: Noida is growing, Ghaziabad is fading. The story of Uttar Pradesh’s two boom towns
Manufacturing sector at regional and district level
The stage of structural transformation can be measured by the contribution of the manufacturing sector in an economy. The manufacturing sector provides a higher labour productivity than agriculture and is considered to be the engine of growth not only in terms of providing employment but also due to immense potential for forward and backward linkages. Therefore, it becomes important to understand UP’s economy through the lens of manufacturing.
What accounts for this intriguing negative growth of manufacturing during 2017-20? It is not the lockdown brought on by Covid-19, because our analysis of data ends before the pandemic struck India. To understand better we employ a district and regional level dis-aggregation. We compute the regional share and growth of the manufacturing sector across four regions of the state: western, eastern, central, and Bundelkhand (Table 2). We have computed this growth from aggregating the Gross District Domestic Product (GDDP) data and this may not be strictly comparable with the previous Table. We also provide the growth for the entire state based on this dataset in the last row.
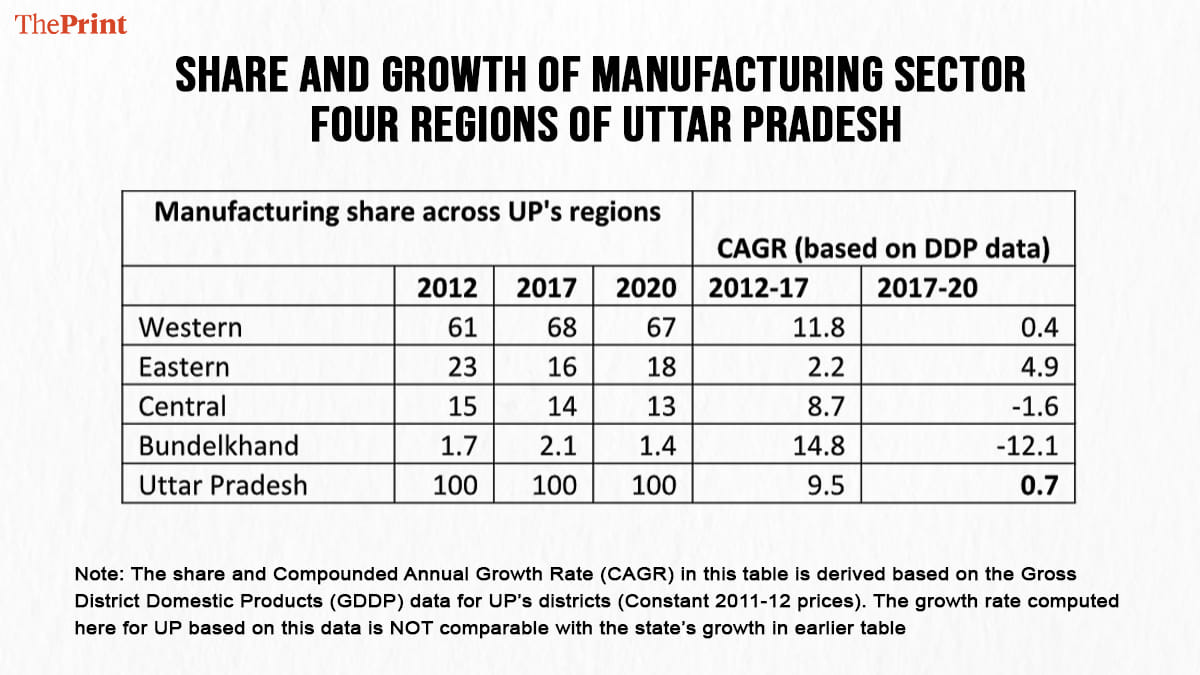
The western region (comprising 30 districts) contributes to about two-thirds of the manufacturing activity in Uttar Pradesh. The share for eastern region (comprising 28 districts) is about a fifth. The contribution of the central region (10 districts) is less than a sixth, and is declining over the years. The manufacturing activity is negligible in Bundelkhand region (comprising 7 districts). We notice that the western region has suffered the most in manufacturing. It was practically stagnant during 2017-20, whereas it grew at 11.8 per cent during 2012-17. An industry-level analysis, using Annual Survey of Industries data may provide us with deeper insights.
Which are the most important manufacturing districts of Uttar Pradesh and how have they performed during the period under investigation? We list the top 10 manufacturing districts (based on the manufacturing output in 2011-12) in the state (Table 3). We note the following points.
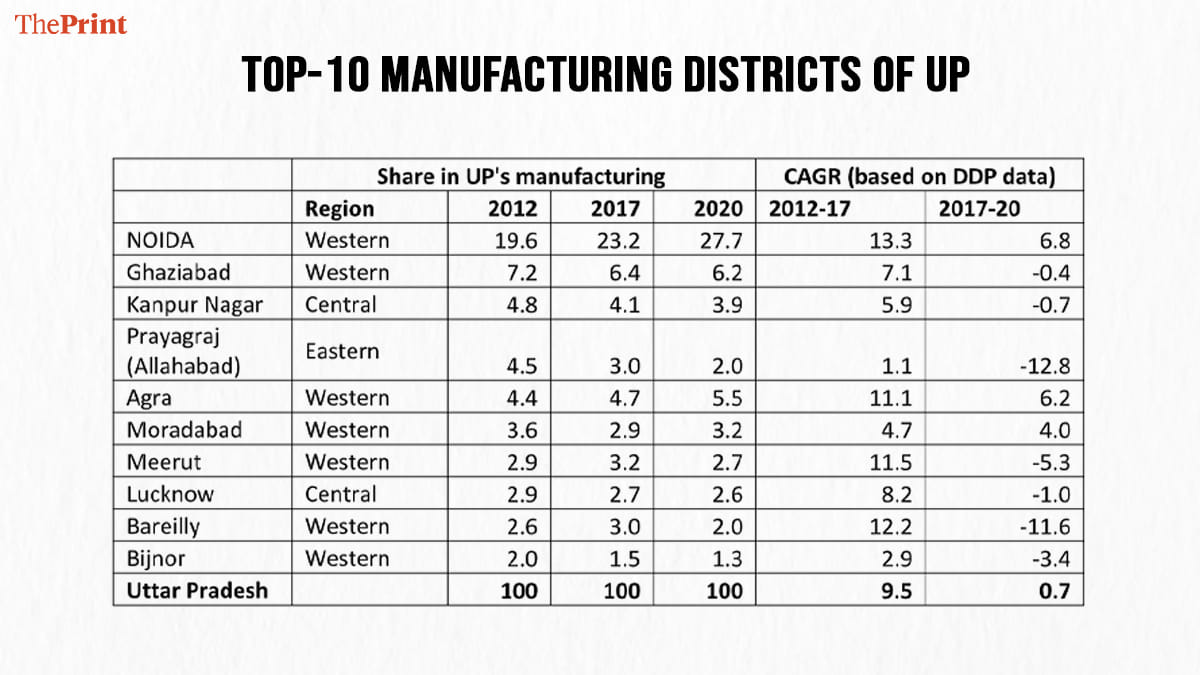
First, Gautam Buddha Nagar (Noida) ranks first. This district alone contributed about 19.6 per cent of the state’s manufacturing output in 2011-12. This climbed to 27.7 per cent in 2019-20. This district alone contributes more to manufacturing than the other regions – eastern, central, or Bundelkhand – of the state.
Second, the growth of manufacturing in Gautam Buddha Nagar district has slowed down substantially from 13.3 per cent (2012-17) to 6.8 per cent (2017-20).
Third, Table 3 shows the predominance of the western region. Seven of the top 10 manufacturing districts of the state fall in this region. The other districts are one from eastern region (Prayagraj, formerly Allahabad), and two from central region (Kanpur Nagar, well known for its leather industry, and Lucknow, the state’s capital).
Fourth, Ghaziabad, a district that shares the boundary with the national capital as well as with Noida, has seen a steep decline in manufacturing activity. The district saw a negative growth of -0.4 per cent during 2017-20 compared to a healthy growth of 7.1 per cent during the Samajwadi Party government.
Finally, the growth of all the other top districts of UP has similarly declined. This sentiment is in line with the decline of old industrial cities of the state.
Also read: Noida vs Gurugram race is heating up. All eyes on Chautala’s job quota and Yogi’s Jewar
Conclusion
Our analysis shows that the economy of Uttar Pradesh has not seen any structural break in a favourable direction under the current government. The manufacturing sector has suffered severely in the first three years of its rule.
It may be worthwhile to reiterate that our analysis ends just before the Covid-19 pandemic, and the subsequent lockdown, hit India. A recent report points to the adverse effect it had on the livelihood of the poor people. It remains to be seen if the precarious economic condition affects the outcome of the 2022 Uttar Pradesh assembly election. As for the data, the big economic claims of the current dispensation do not hold up. The case of manufacturing is especially worrisome.
Vikash Vaibhav is Assistant Professor at Dr. B.R. Ambedkar School of Economics (BASE), Bengaluru. He tweets @VikashVikashv.
Varun K. Das is Assistant Professor at Delhi School of Economics.
Akhilesh K. Verma is a research fellow, Economic and Social Research Institute (ESRI), Dublin, Ireland. He tweets @AkhileshV_. Views are personal.
This article is part of the ‘UP in numbers’ series. Read all the articles here.
(Edited by Prashant)