


Elections to the Lok Sabha are highly competitive. Indian politicians win with smaller margins than their counterparts in other countries with a similar electoral system, such as Canada and the United Kingdom.
In a first-past-the-post electoral system, a candidate needs 50 per cent plus one vote to win the election if only two candidates compete for a seat. If there are three candidates who are equally strong, a winning candidate will need only one-third of the votes plus one additional vote. In India, usually a large number of candidates compete for each Lok Sabha seat, many of whom are non-serious. This makes it possible for several Indian politicians to get elected with a very low vote share.
And, this may have important implications for their legitimacy and accountability as people’s representatives.
Also read: Political parties dominate India’s national elections, not candidates
Vote share & popularity
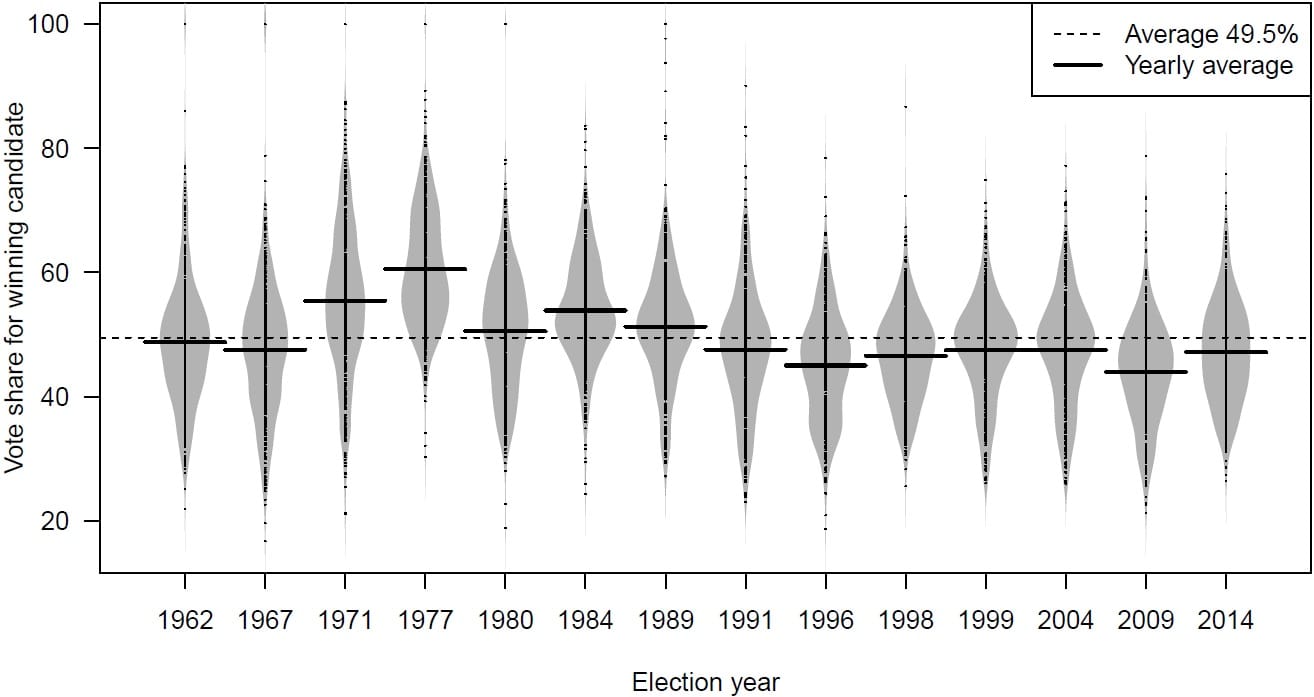
Figure 1 shows the constituency-level percentage of the vote received by the candidates who won in each constituency between 1962 and 2014. The winning vote share is informative because it tells us how much support a politician actually had in her constituency. This can be viewed as a sign of the legitimacy a politician has as a representative of the area she is elected from.
The horizontal black line in the bean plots in Figure 1 shows the average winning vote share for each year. The winning vote share for each constituency is represented by the small black dots along the centre of each bean. The thickness of each grey bean indicates the distribution of the constituencies. In a wider bean, more constituencies have approximately the same winning vote share. A thinner bean means that there is more variability in the data, implying that in some constituencies the winner got a very low share of the votes and in others a fairly high share. The figure does not report values less than 15 per cent, since no candidate won a Lok Sabha seat with less than 15 per cent of the total votes. The maximum value reaches 100 per cent, like in the rare cases when a candidate runs unopposed.
Between 1962 and 2014, Indian MPs were elected with an average of 49.5 per cent vote share. Half the MPs were elected with a vote share ranging between 43 per cent and 55 per cent. However, quite a few candidates were elected despite a very low vote share.
For instance, in Shahjahanpur constituency in Uttar Pradesh in 1967, 12 candidates contested from the seat and nine of them managed to get more than five per cent of the total votes. The winner, P.K. Khanna, was elected to the Lok Sabha with only 16.7 per cent vote share.
Figure 1 shows that in the elections to the Lok Sabha between 1971 and 1989, the winning candidate on an average received a vote share of over 50 per cent. The average winning vote share of an MP since the 1991 Lok Sabha election has been just shy of 47 per cent. In 2014, the average winning share was just over 47 per cent.
Figure 1: Vote Share of Winning Candidate 1962-2014
of voting patterns in Indian elections”. Cambridge University Press. Chapter 2.
Also read: 3 charts challenge lazy thinking on voter turnout and its link to literacy & urbanisation
Was 2014 election different?
Contrary to common belief, the 2014 Lok Sabha election was not exceptional when it came to the vote share of the winning candidates. In fact, the vote share of the MPs elected in 2014 looked very similar to the pattern observed in the elections held between 1991 and 2004.
The most exceptional election in this period was actually the 2009 election, when the winning candidates received just 44 per cent of the vote share on an average. This implies that at the constituency level, the 2009 election, where the UPA government was voted back to power, was the most competitive election India witnessed in the last five decades.
Margin of victory & competitiveness
Another commonly used measure for understanding the degree of competition in an election is the Margin of Victory (MoV), or simply the difference between the vote share received by the winner and the runner-up in a constituency. The MoV tells us whether a seat was won by a narrower or a wider margin.
This measure is important because parties and politicians may care more about competitive areas, where MoV is smaller, than the places where they win overwhelmingly. For example, a study of MPLADS spending shows that politicians in safer constituencies are less likely to spend all their available funds. It may also be easier to hold politicians accountable in constituencies where they are not so sure of being re-elected.
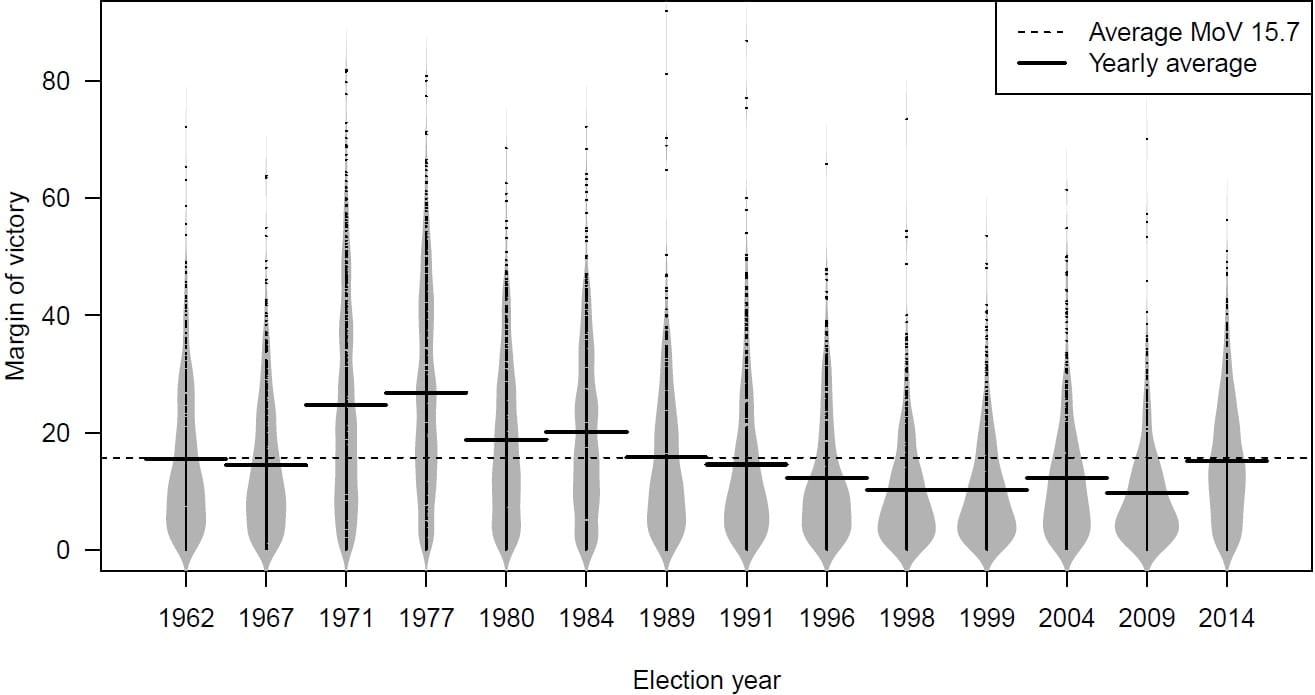
The bean plot in Figure 2 shows the MoV in Lok Sabha elections between 1962 and 2014. If there are only two candidates competing for a seat and if the winning candidate receives 50 per cent of the vote share and one additional vote, then the runner-up must have garnered one vote less than 50 per cent. In this case, the MoV would be close to zero. If the winning candidate gets 60 per cent of the total votes and the runner-up 40 per cent, the margin of victory will be 20 per cent. If only two parties compete from a seat, the MoV can be derived directly from the winning percentage.
Figure 2: Margin of Victory (MoV) 1962-2014
of voting patterns in Indian elections”. Cambridge University Press. Chapter 2.
Also read: Why voters don’t turn up in larger numbers in Lok Sabha elections – all politics is local
When multiple candidates are in the fray
If there are multiple candidates competing in a constituency, as is often the case in India, it is possible for both the winning percentage and the MoV to be low.
For instance, if a winning candidate gets 40 per cent of the total votes, her main opponent could receive a vote share of one vote less than 40 per cent. However, it is also possible that the runner-up gets a really small vote share, say 30 per cent, and other candidates in the constituency share the remaining votes. An MoV of 10 per cent would indicate that the leading candidate won easily and the vote share was fragmented, i.e. many parties had a share in the total votes polled.
Figure 2 shows that the average MoV between 1962 and 2014 was 15.7 per cent. This indicates that many politicians won with a comfortable margin. The elections from 1971 to 1989 were unusual in the sense that they saw a greater than average MoV. The bean plots are extremely stretched out during this period, indicating that there was great variation in the MoV in constituencies across the country.
Since then, the average MoV has hovered above 10 per cent, with the exception of 2009 when it was slightly less than 10 per cent. In other words, we again see that the 2009 election was unusually competitive at the constituency level. However, according to this measure, the 2014 election also stands out as the MoV jumped quite substantially compared to the 2009 election, almost up to the level of the 1989 election.
The bean plots for the Lok Sabha elections held between 1996 and 2009 have a clear pear shape. This means that a substantial proportion of the parliamentary constituencies had MoVs between zero and 10 per cent –indicating very competitive elections. It was the presence of a few constituencies with a very high MoV that pulled up the average value to around 11 per cent.
Contrast these data for Indian elections with the trend in other countries with similar electoral system.
In the UK, only 35.4 per cent of the constituencies were won by an MoV of less than 10 per cent in 2010 and 2015 elections. In Canada, the number is closer to India where 55 per cent of the seats had an MoV of less than 10 per cent for the elections of 2006, 2008, and 2011.¹
Also read: This data shows why Indian MPs don’t truly represent their people
Accountability & legitimacy
Electoral competition, measured as MoV, is often described as a sign of a healthy democracy because the threat of losing an election should make politicians more accountable to their voters. We see some evidence of this in India too.
However, the fact that candidates can win with a small vote share may also have the opposite effect. A politician may have little legitimacy in her constituency if she is only supported by a fraction of the voters, and this may also make her feel less accountable to them. Knowing that she has few supporters, coupled with the fact that most politicians are either not re-nominated by their parties or not re-elected by the voters, may also reduce her interest in performing well in office.
¹Bernard Fraga and Eitan D. Hersh. Are Americans Stuck in Uncompetitive Enclaves? An Appraisal of U.S. Electoral Competition, Quarterly Journal of Political Science, 2018, 13:1–21
Pradeep Chhibber is with the University of California, Berkeley. Francesca Jensenius teaches at the University of Oslo. Harsh Shah, an alumnus of the University of California, Berkeley, is a political analyst and works in the private sector.
This is the fifth in a series of articles in ThePrint that will provide readers with comprehensive, research-based information about the Indian elections since 1962.
The articles will also draw upon recent findings from Constructing a Majority: A micro-level study of voting patterns in Indian elections (forthcoming Cambridge University Press) by Francesca Jensenius, Pradeep Chhibber, and Sanjeer Alam. Read the first article here, the second article here, the third article here and the fourth here.