The first advance estimates of Gross Domestic Product (GDP) for the current year showed that the economy is estimated to post a strong growth of 7.3 percent. However, a cause of concern was the subdued growth in private final consumption, a proxy for consumption by households.
While the GDP figures present an aggregate picture, it is worthwhile to look at the high-frequency indicators to get a sense of the segments that may be experiencing a demand slowdown.
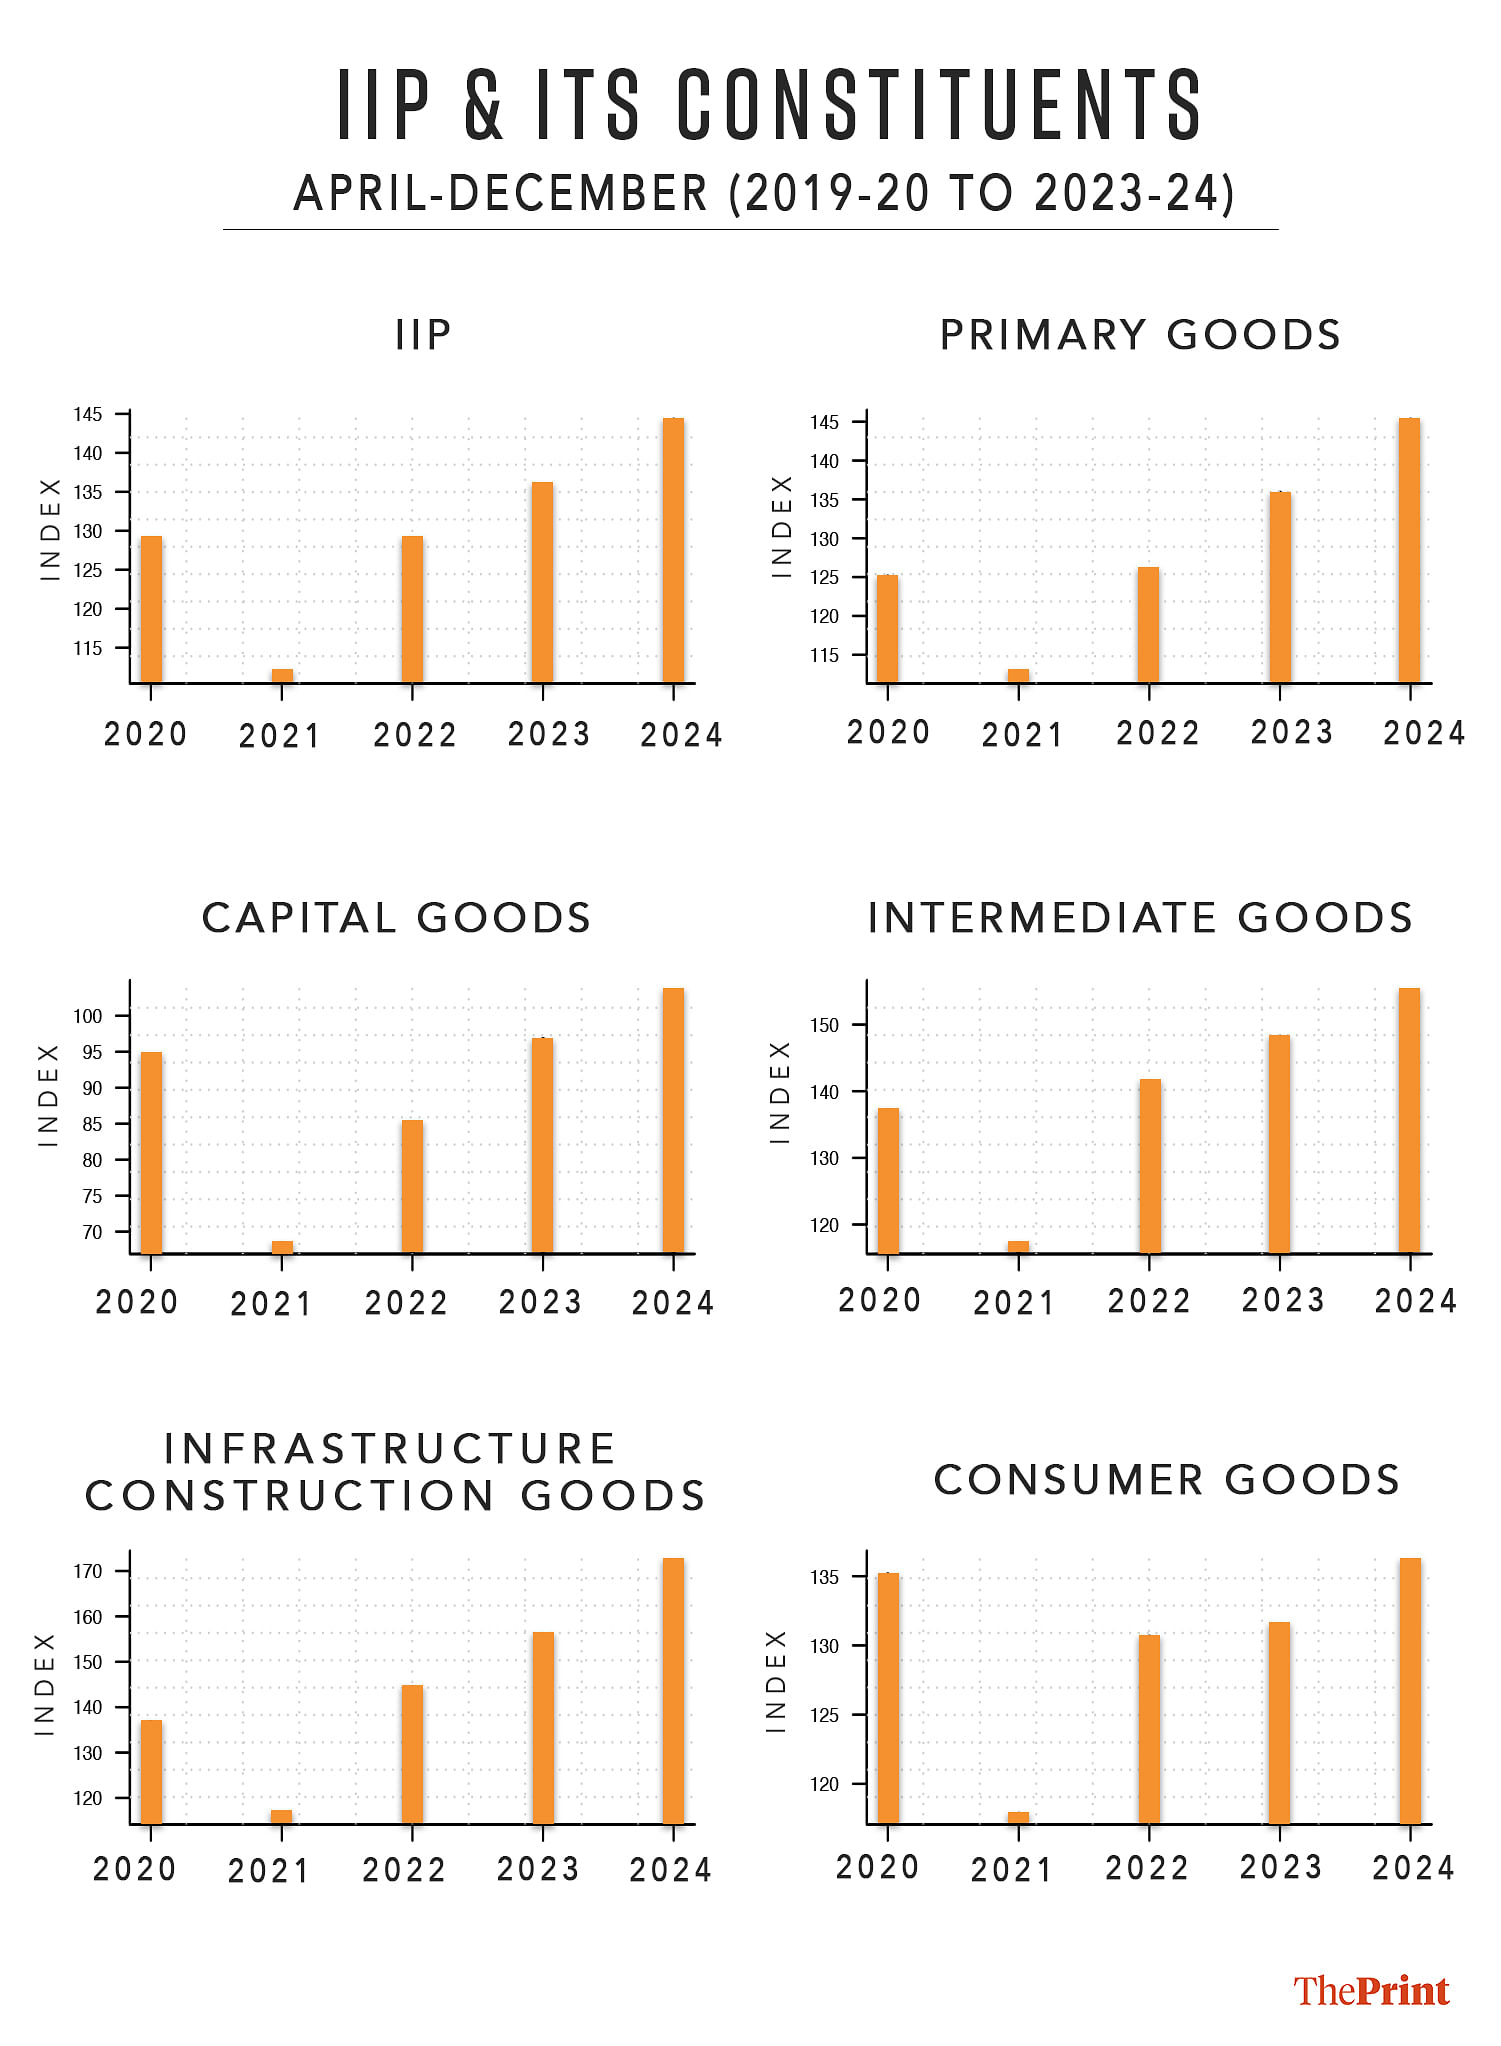
As a first step, we analyse the trends in production to understand the key drivers of economic activity. From a use-based classification, the Index of Industrial Production (IIP) has five constituents: primary goods, capital goods, intermediate goods, infrastructure and construction goods and consumer goods.
Consumer goods are further categorised into consumer durables and nondurables.
A simple comparison of the trajectory of index numbers for the last five years, starting 2019-20, suggests that the most significant spurt is seen in the production of infrastructure and construction goods. This can be attributed to the government’s thrust on infrastructure development and surge in residential housing demand. Improvement is also visible in the indices capturing primary, capital and intermediate goods production.
However, the IIP for consumer goods shows subdued growth. The index number for April-December of 2019-20 was 135.1 and for the same period of the current year, it is 136.1. In fact, in the intermittent years, the index number was lower than the index number for the pre-Covid year. In other words, at a broader level, the production of consumer goods this year has not seen much increase compared to the pre-Covid period.
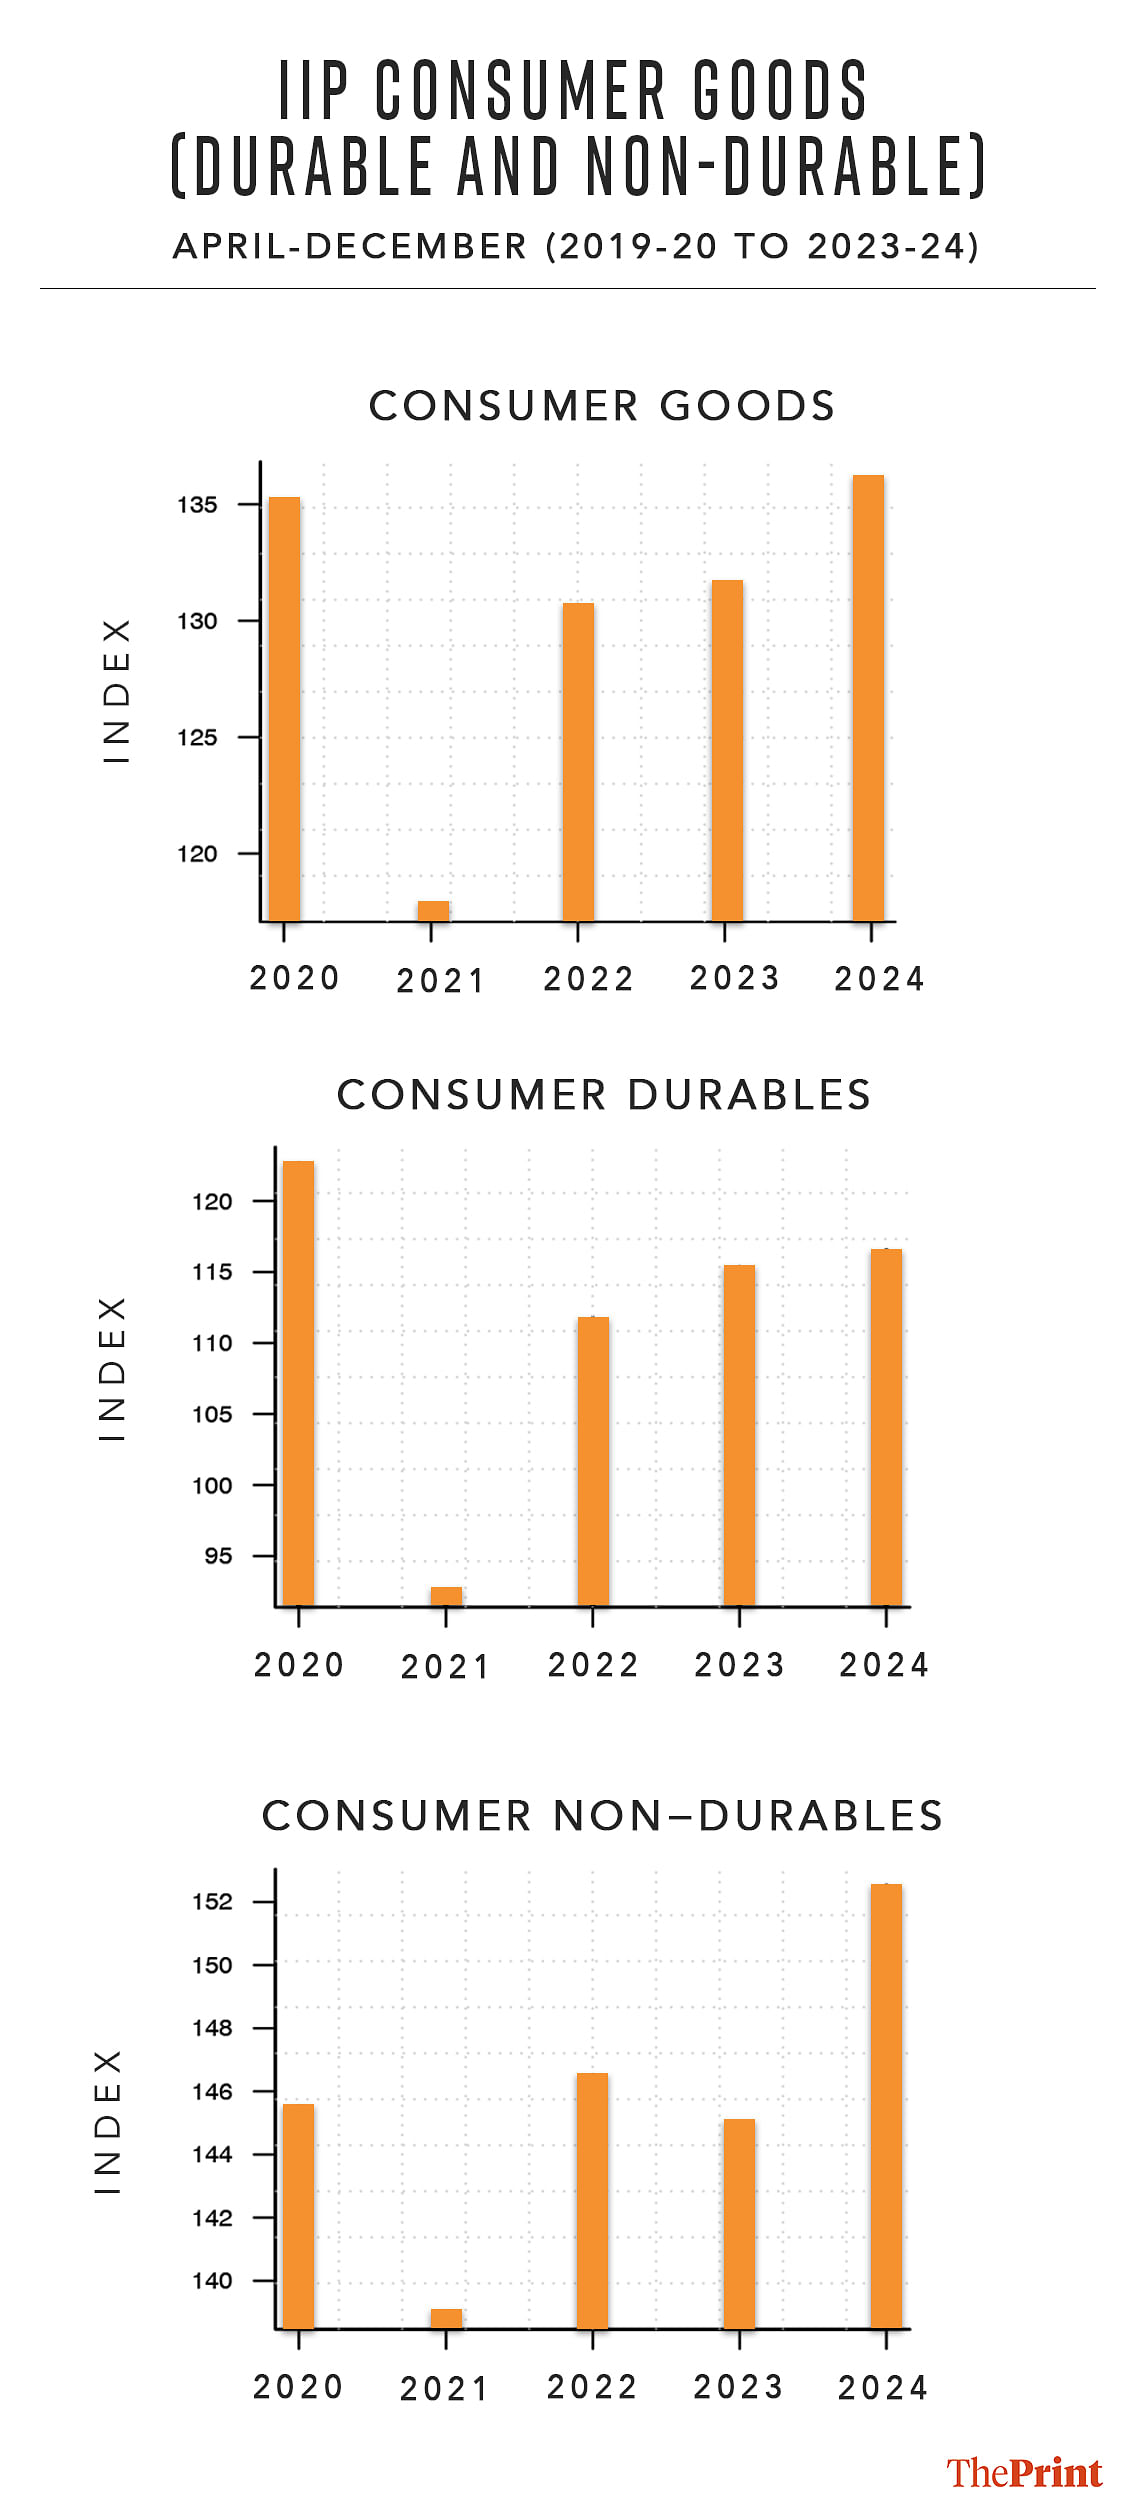
A further breakdown of consumer goods production into durables and nondurables suggests that the slowdown is mainly on account of durable goods production. The IIP for consumer durables for the current year is lower than the IIP for the same period in the pre-Covid year.
Readymade garments, not knitted and footwear are amongst the key segments that have dragged the production of consumer durables. Their aggregate production in the nine months of the current year is lower than the corresponding period in the pre-Covid year.
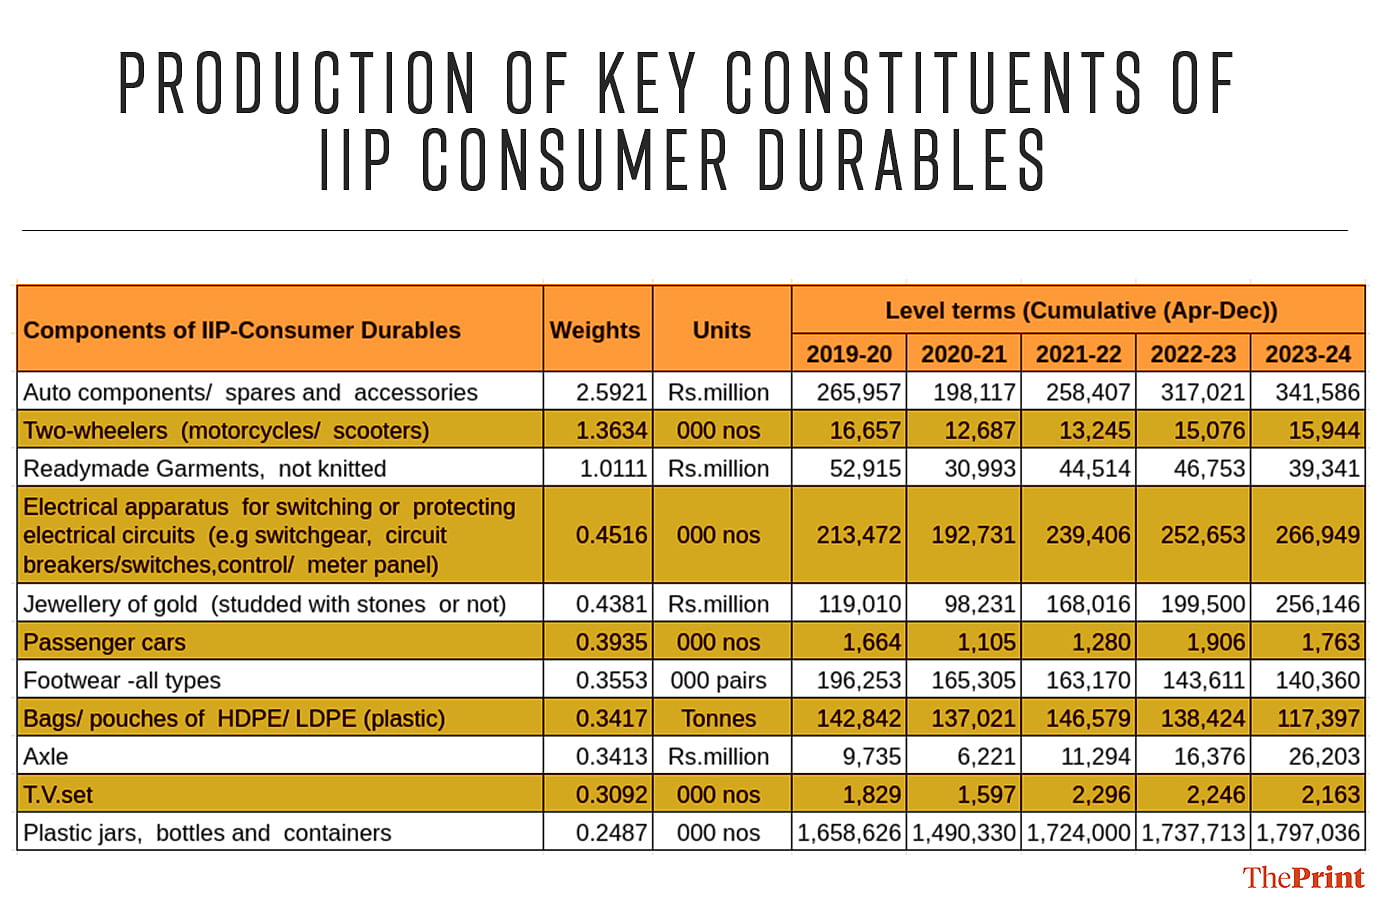
While the overall index for nondurable goods production is higher than the pre-Covid level, some items of mass consumption such as toilet soaps, detergent cake and toothpaste have seen a dip in production when compared to pre-Covid levels. However, the decline in production is not broad-based with some items such as sugar, rice and antibiotics, API and formulations witnessing an increase in production compared to pre-Covid levels.
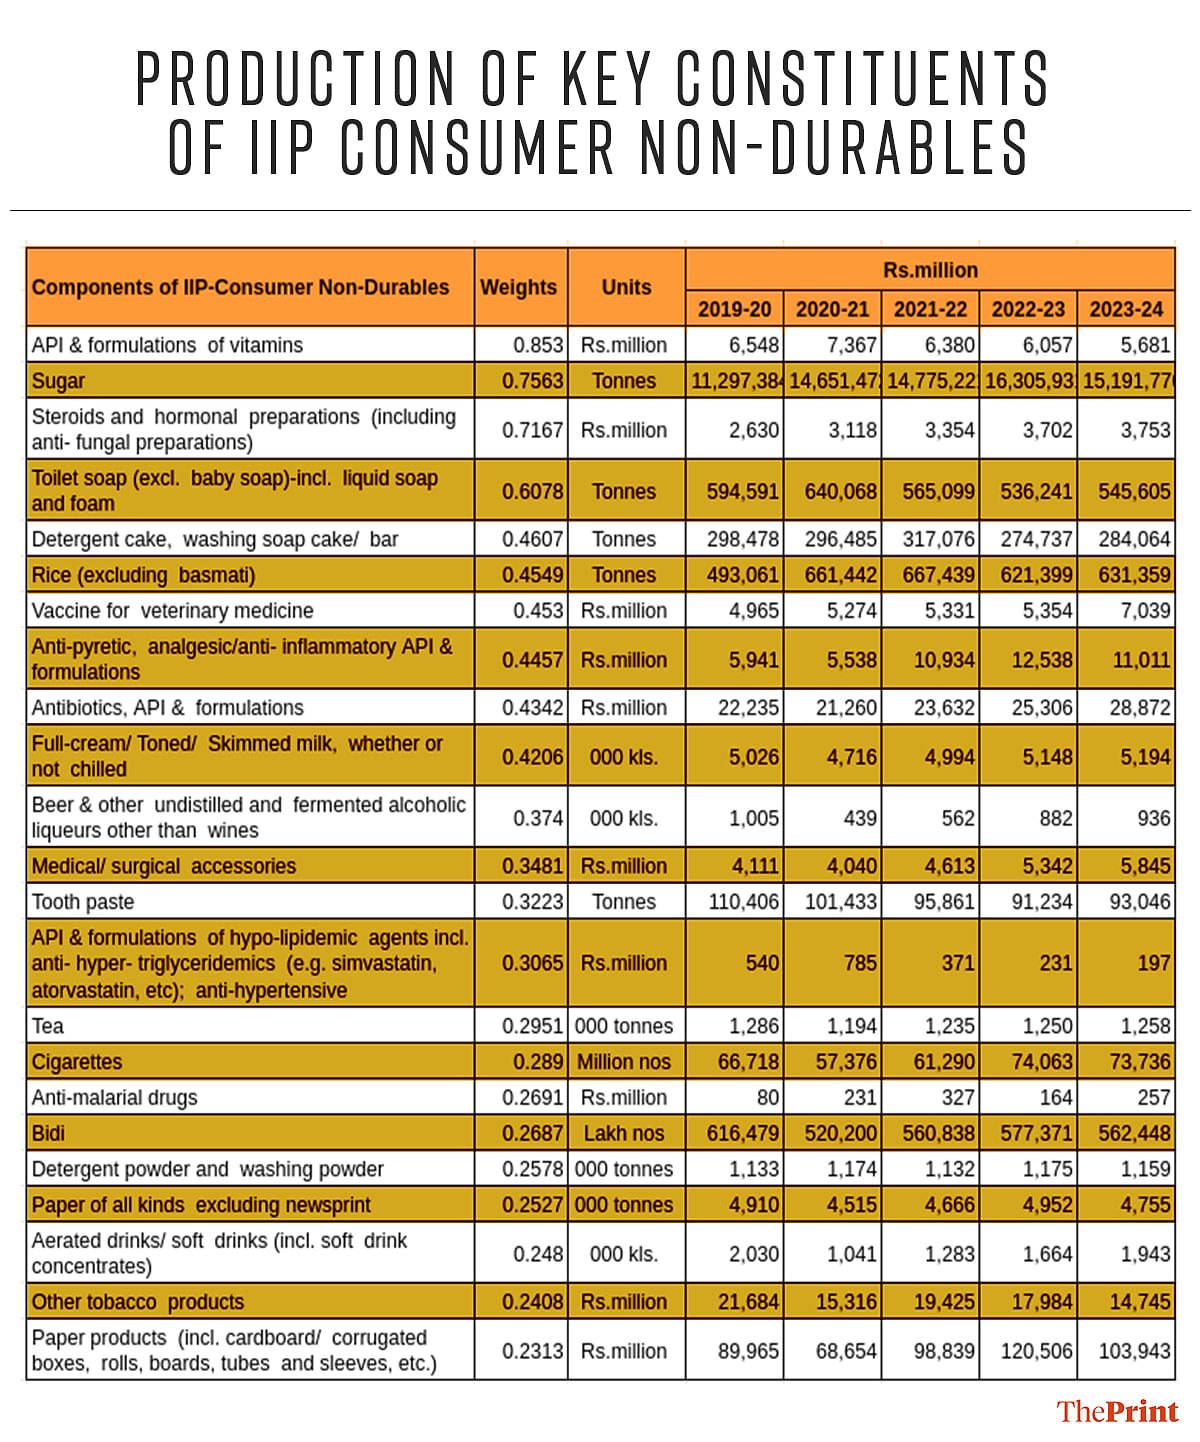
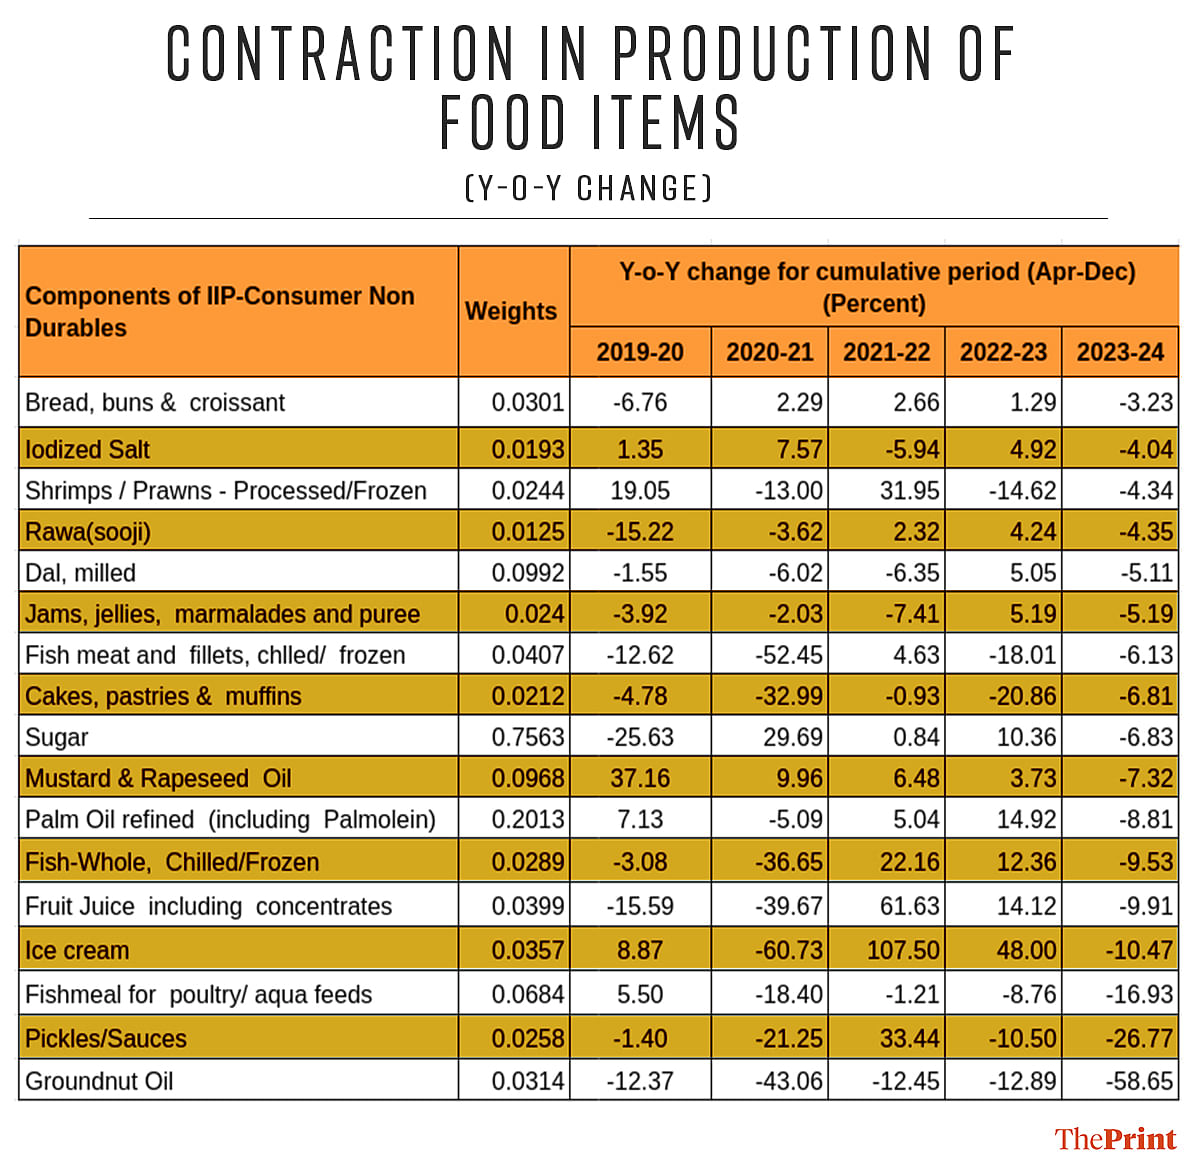
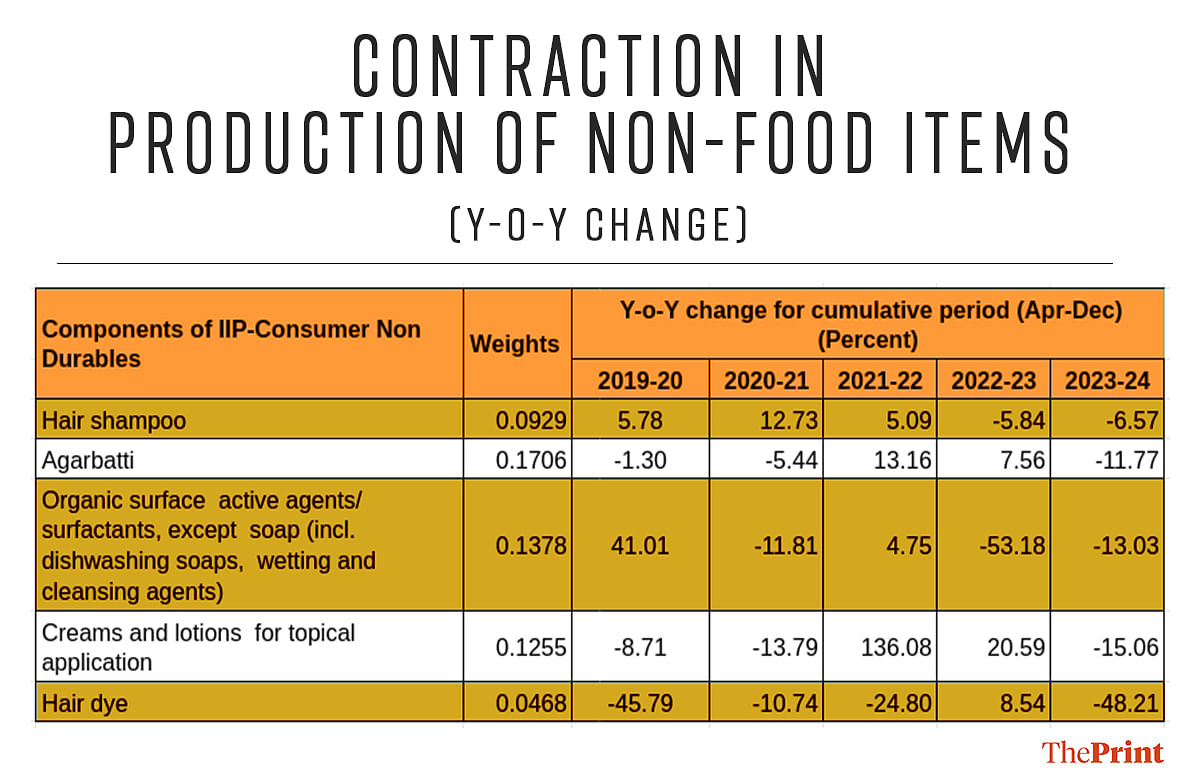
At the same time, the current year has seen subdued production of some items of mass consumption in comparison to the previous year. Production of items such as salt, pickles, creams and lotions, biscuits is lower in the nine months to December of the current year as compared to last year. The decline in production of these items is a reflection of subdued consumption demand.
Also Read: Uncertainty over food & oil prices — why India, like other countries, held its policy rates steady
Sales of passenger vehicles present mixed picture
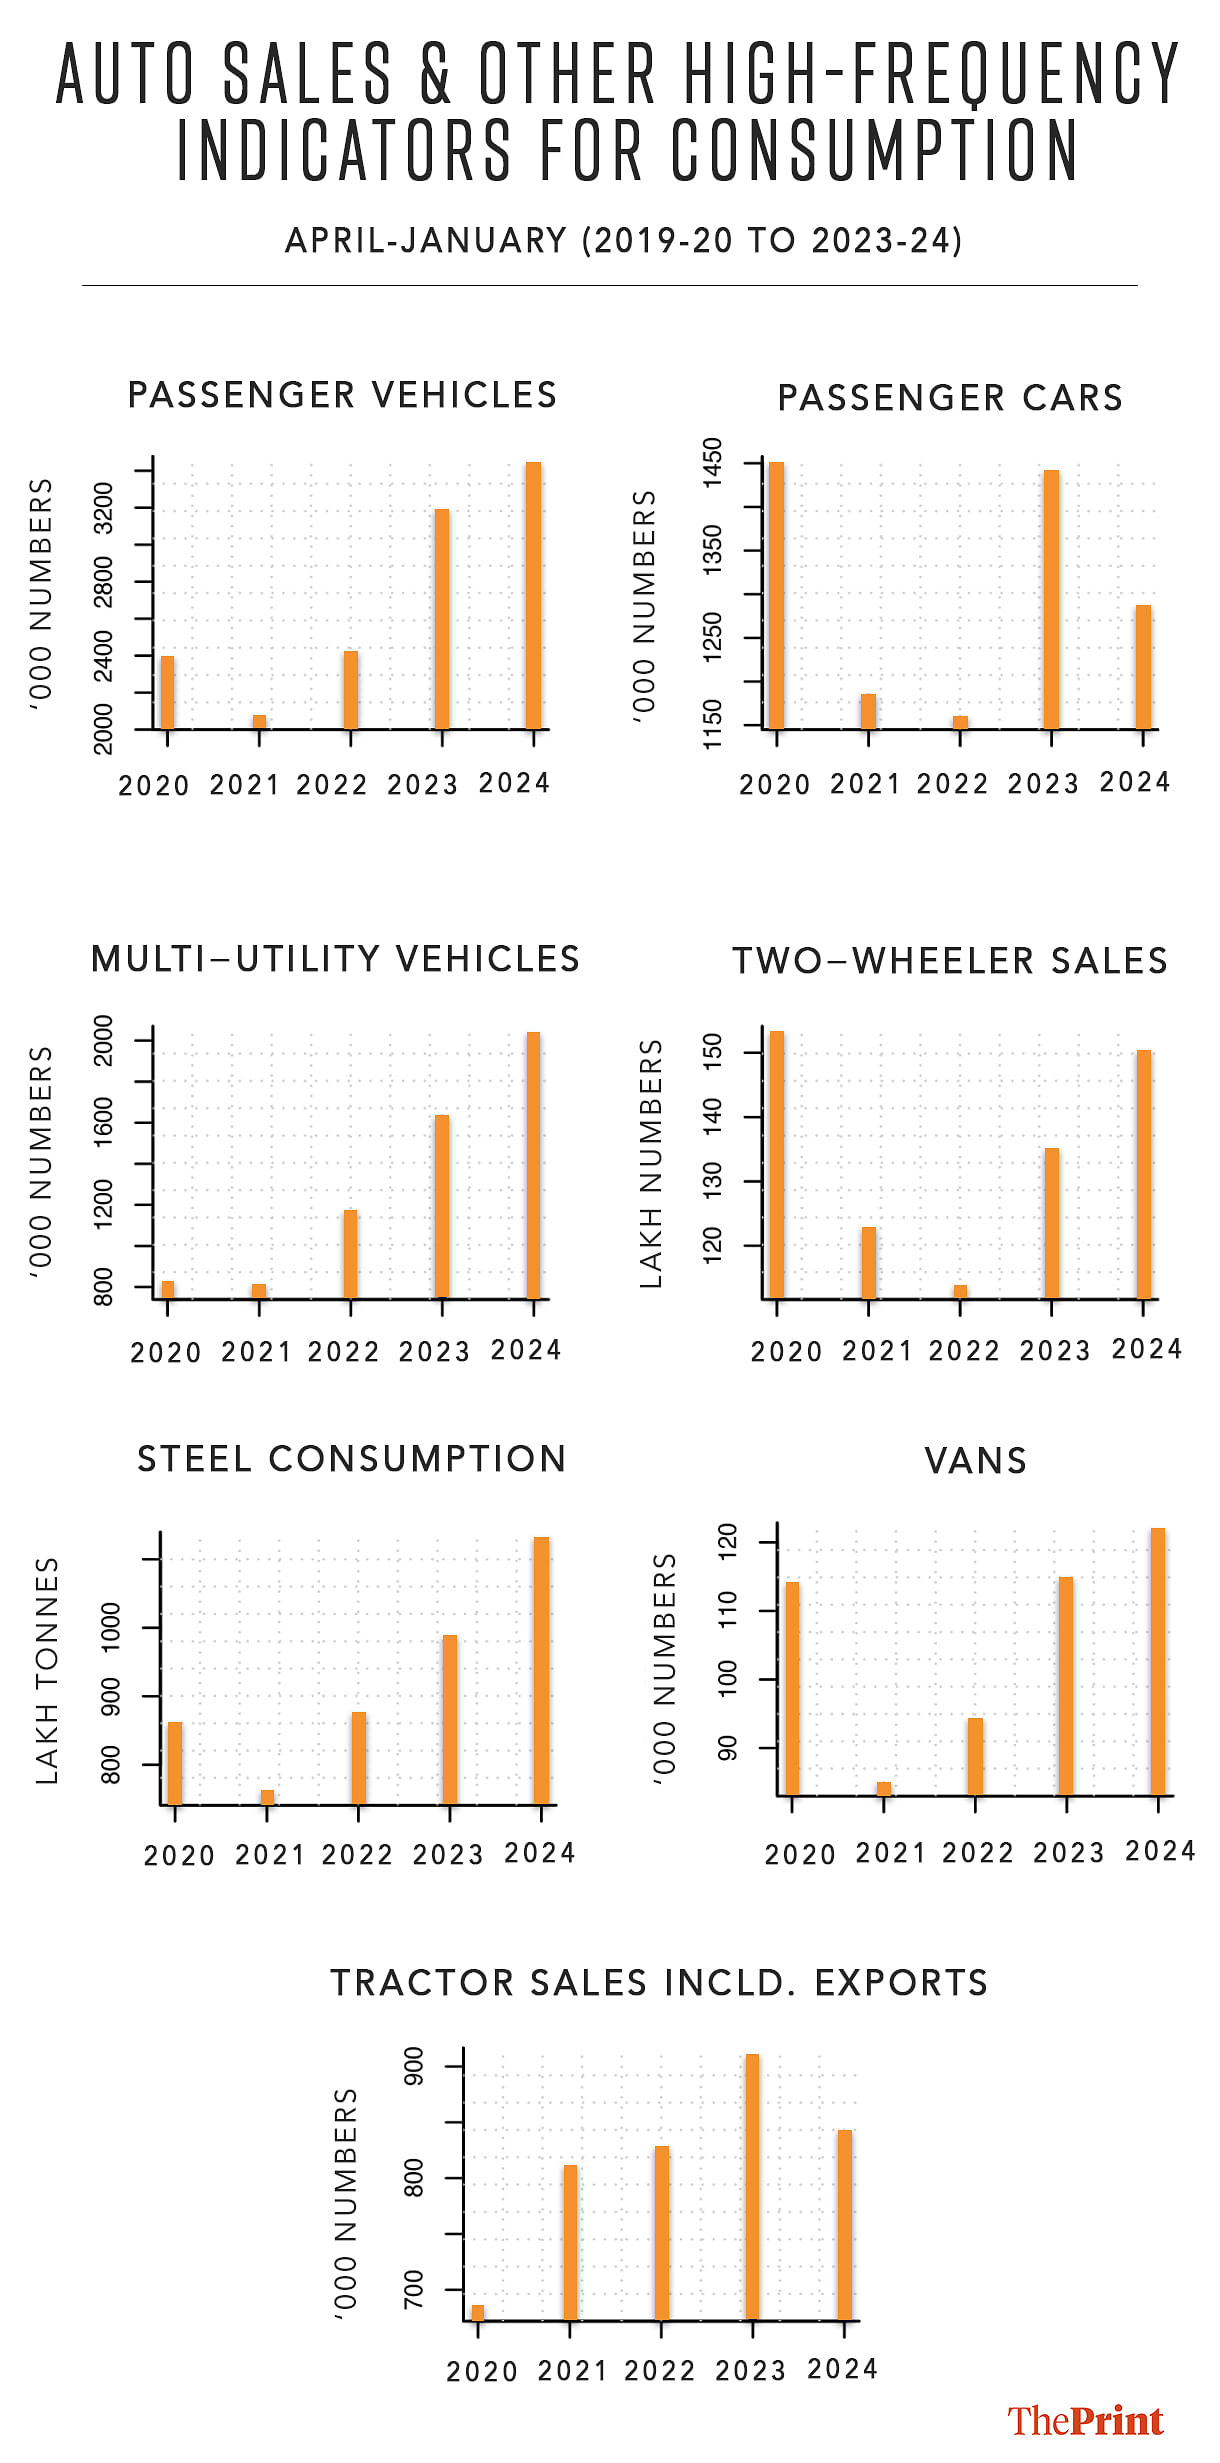
The trajectory of sales of passenger vehicles, another proxy indicator for consumer demand, presents a mixed story. Passenger vehicles comprise cars, vans and multi-utility vehicles (MUVs).
In the 11 months to January, a total of 2.3 million passenger vehicles were sold in 2019-20. After witnessing a slump in the Covid year, the sales of passenger vehicles have picked up pace. In the 11 months of the current year, more than 3.4 million units have been sold.
Clearly, the passenger vehicle sales have surpassed the pre-pandemic sales.
However, this growth in sales has been driven by MUVs. The sales of MUVs have jumped from 8 lakh units in the 11 months of 2019-20 to more than 2 million units in the corresponding period of the current year.
In contrast, the sales of passenger cars have seen a moderation since the pre-Covid year. The demand for utility vehicles seems to have been driven by rising disposable incomes, an influx of new sport utility vehicles and relatively comfortable loan rates.
Quarterly sales as barometer of demand
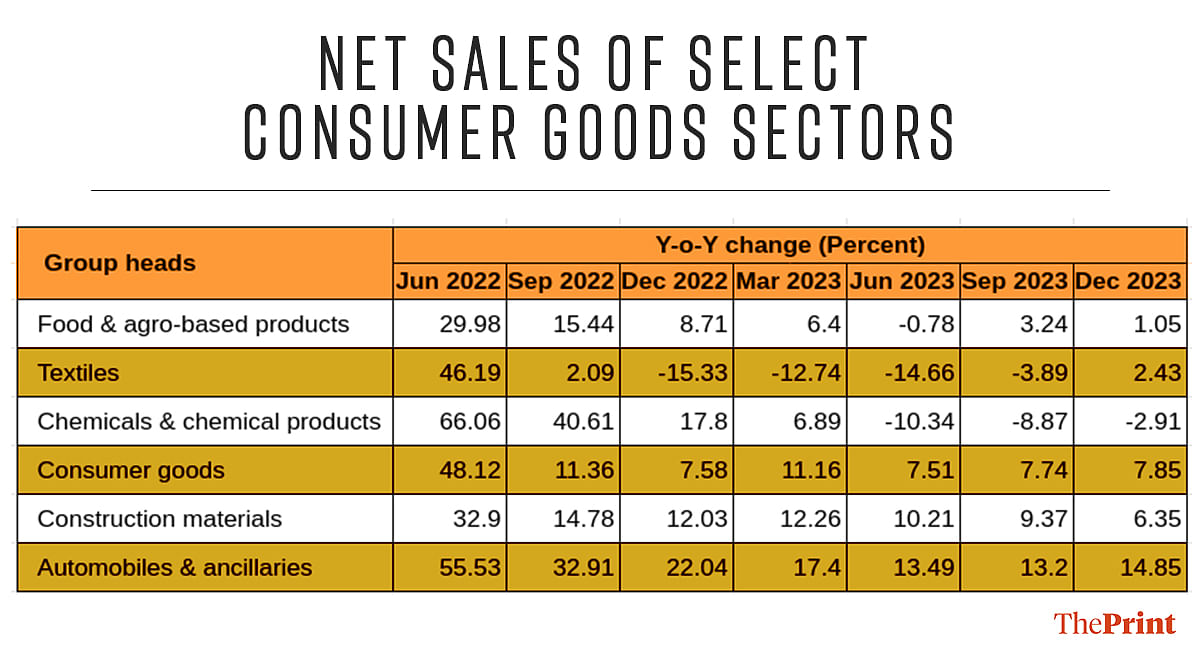
The sales of companies in the consumption segment is another useful indicator of the demand conditions. The revenue of the companies in the food and agro sector has been on an upward trajectory in 2022 but has seen a reversal in trend in the first two quarters of the current year.
In the December quarter, the net sales of companies in the food and agro-based products reported a muted sales growth of 1.05 percent. Particularly, the companies producing tea, coffee, sugar, vegetable oils and products reported a contraction in sales in the December quarter.
Rural India constitutes roughly 35-40 percent of the sales of a typical consumer company. This segment has been reeling under inflationary pressure, resulting in a dip in sales. Because of high food inflation, the consumption is skewed towards essential items.
Consumer goods companies have reported stable sales growth of 7.8 percent but a prominent sub-category, personal and home-care products have seen a consistent deceleration in sales since December 2022.
On the other hand, auto sector companies registered an impressive sales performance with passenger vehicle and three-wheeler segments posting their highest third quarter sales ever. Two wheeler sales also recorded strong growth in sales in the December quarter.
Dual trends in sales but companies optimistic
Companies are witnessing a dual trend in sales growth.
Rural, mass and home and personal care categories are seeing lower sales than urban and premium products. Companies have attributed the subdued rural sales to lower agricultural yields and uncertainty of future crop outputs that have suppressed the consumer sentiments.
Rural income growth and winter crop yields will be key factors that will determine the pace of recovery.
Going forward, companies are optimistic of a gradual pick-up in consumption in light of increased government spending and moderation in inflation.
Radhika Pandey is associate professor at National Institute of Public Finance and Policy (NIPFP).
Views are personal.
Also Read: India’s resilient economy faces risks from Red Sea, higher US inflation & patchy recovery in China


