


Retail inflation measured by the year-on-year change in Consumer Price Index (CPI) moderated sharply to 5.88 percent in November from 6.7 percent in October. This is the first print below 6 per cent, the upper threshold since January this year.
The decline was due to moderation in food prices. Food prices eased on account of lower vegetable prices though the prices of cereals and milk continue to remain elevated. Fuel inflation reversed the trend of moderation seen in the last few months. It inched higher to 10.6 per cent in November from 9.9 per cent in the previous month. Core inflation remained elevated at above 6 per cent.
The softening of inflation in November was also driven by the base effect with the CPI number for November last year being on the higher side. This advantage of the favourable base effect may not be available in the coming months.
Moderation in food inflation but cereals inflation inched up and core inflation remained persistent
Vegetables inflation contracted to 8 per cent in November. With winter arrivals, there is typically an easing of prices of vegetables. However, inflation in cereals rose to touch almost 13 per cent in November from 12 per cent in October, owing to increase in prices of wheat and rice. While inflation in wheat rose to 19.7 per cent in November from 17.64 per cent in October, it went up to 10.5 per cent from 10.2 per cent for rice.
Production of both the cereals has been impacted due to adverse weather conditions. According to the first advance estimates, rice production in the kharif season is expected to be at 104.99 million tonnes, 2 million tonnes lower than the first advance estimate last year. Wheat output also dropped due to the rise in temperatures ahead of the harvesting stage.
Inflation in milk and its products rose to 8.2 per cent in November from 7.7 per cent in October. Rise in feed and fodder costs have contributed to a surge in milk prices. Crop damage due to heavy and late monsoon has led to deficit and consequent rise in prices of feed and fodder for livestock. Feed and fodder account for 60-70 per cent of the production cost of milk.
Core inflation remained sticky at above 6 per cent for the third consecutive month. While inflation in components such as household goods and services, health, and transport and communication registered an increase, recreation and amusement, clothing and footwear witnessed some moderation.
Sticky core inflation can be attributable to the pass-through of input cost to consumers amid a revival in demand. Stickiness in core inflation is also reflected in high inflation expectations of households. Median inflation expectation for one year ahead stood at 10.8 in November. Though it has slightly moderated, it is higher than the median inflation expectation in the pre-Covid period.
Also Read: Budget 2023 priorities should include thrust on public capex, rural job creation
Do we see moderation in States inflation?
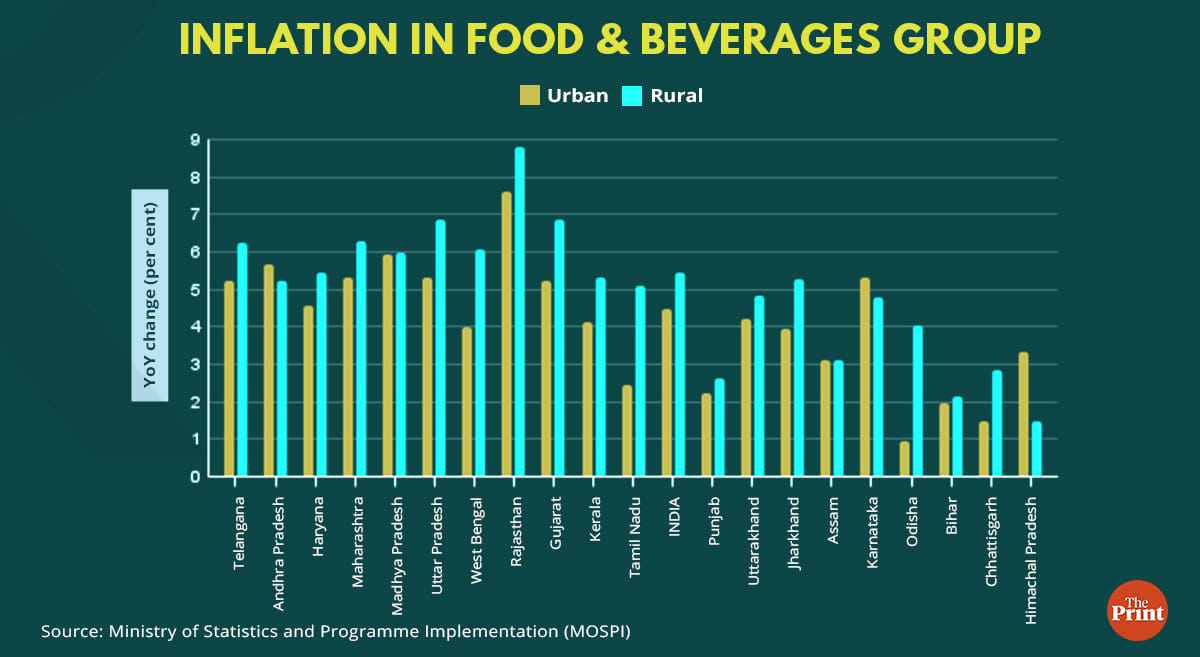
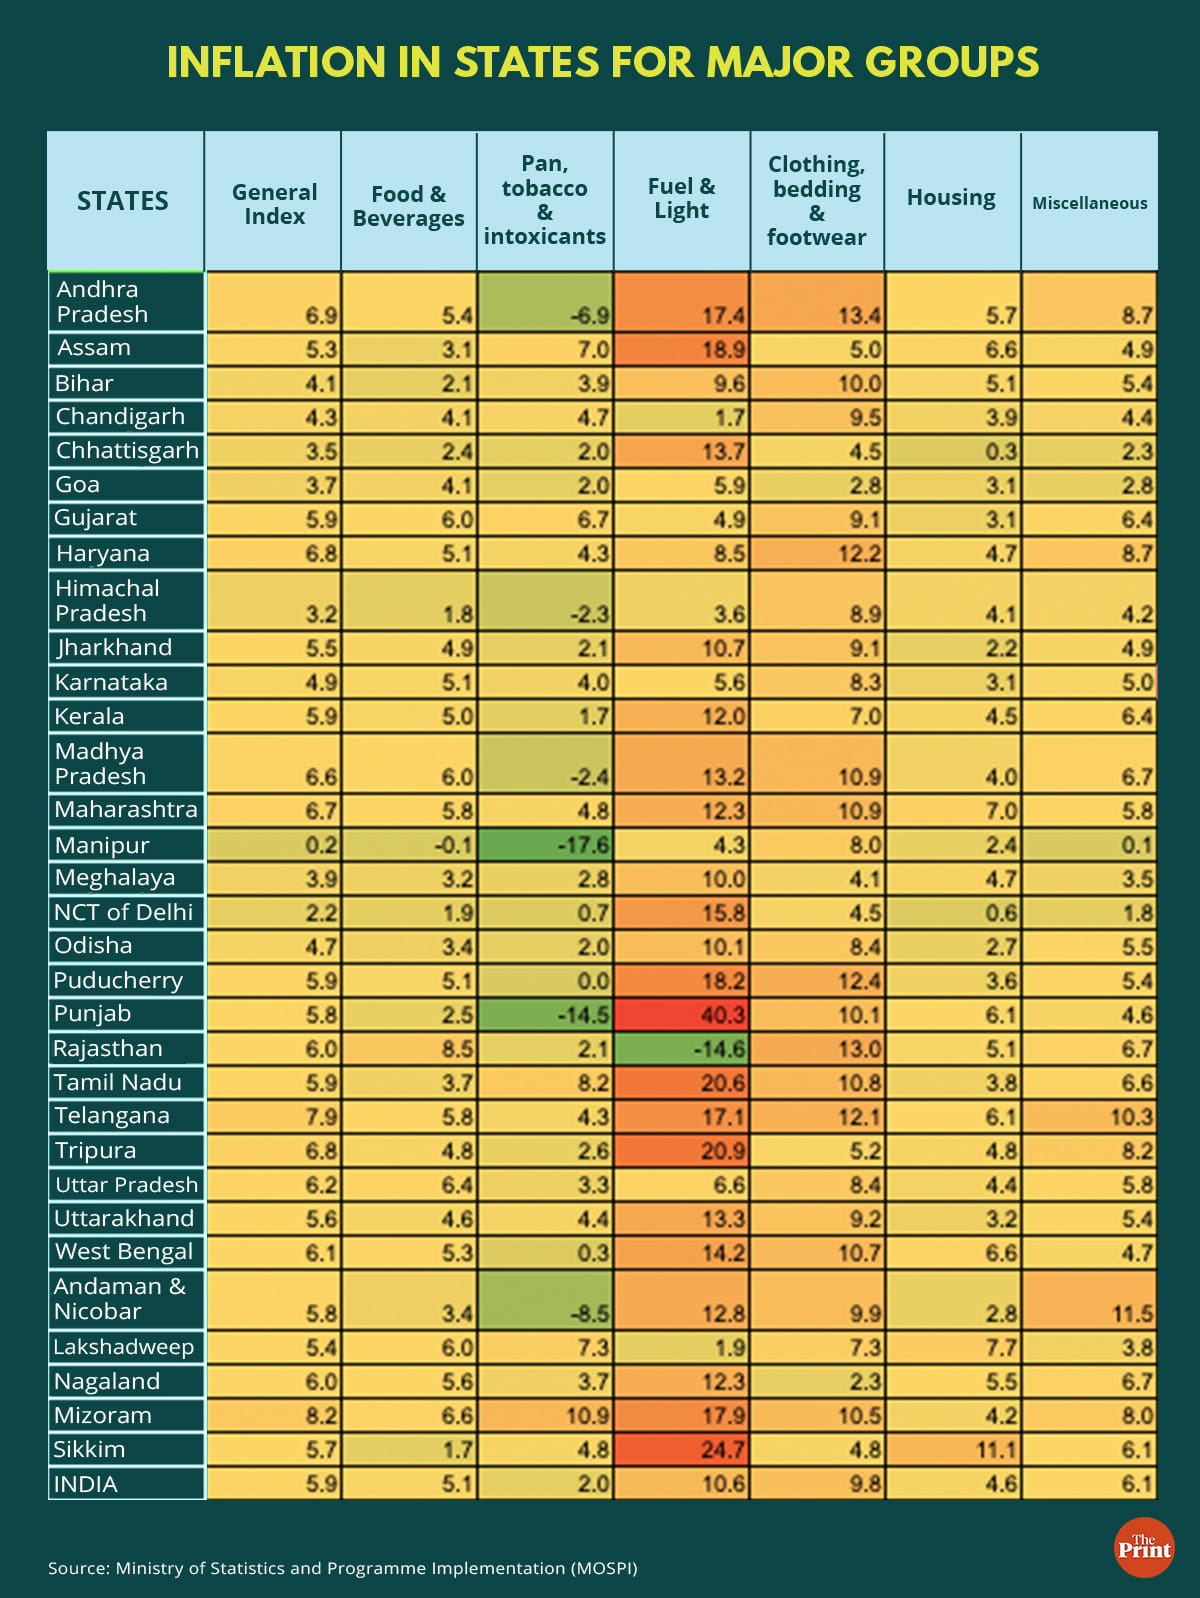
While the all-India CPI inflation moderated to below 6 per cent, seven major states (Andhra Pradesh, Haryana, Madhya Pradesh, Maharashtra, Telangana, Uttar Pradesh and West Bengal) saw inflation above the upper threshold of 6 per cent. For most of the states, rural inflation exceeded urban inflation. Telangana clocked the highest inflation at 7.9 per cent, but this was lower than 8.82 per cent in October.
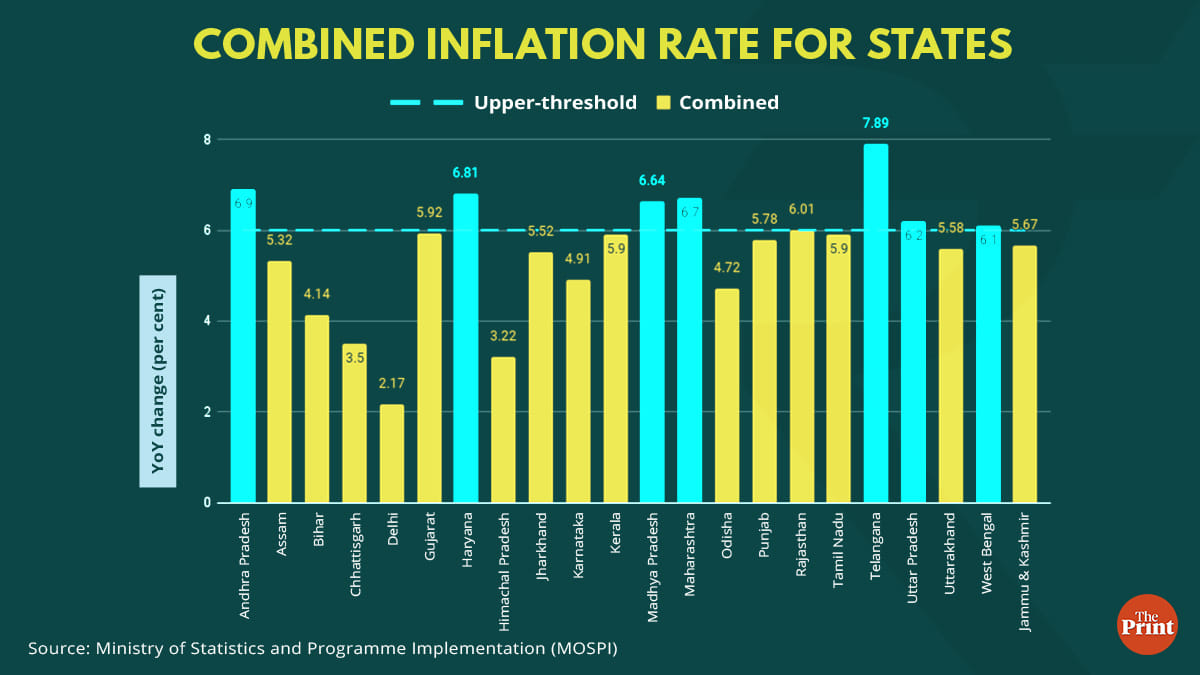
Similar to the all-India level, the moderation in inflation in Telangana was due to decline in food prices. The core inflation components of ‘clothing, bedding and footwear’ and ‘Miscellaneous’ remained in double digits. Similar to the national figure, the decline in food inflation was due to contraction in vegetable prices. Other key components of food inflation such as milk, oils and fats and spices saw a rise in November. Inflation in spices touched almost 22 per cent.
Rajasthan features as the state with the highest food inflation at 8.45 per cent. While contraction is seen in vegetable prices, cereals, milk and milk products and spices saw double-digit inflation. Mandi prices of spices such as cumin, coriander and black pepper have sky-rocketed due to decline in production as well as strong global and domestic demand. Production has been hit as some of the key producing states of spices have shifted to other crops.
At a broader level, core inflation pressures are evident in the inflation data of states. Table below shows that inflation in ‘clothing, bedding and footwear’ is in double-digits for some of the states.
Also Read: Persisting inflation worries, bright growth prospects give RBI room for more future rate hikes
Understanding variation in states inflation numbers
A key component of CPI is the consumption basket of households. The weights for the various items in the CPI are arrived at based on Consumer Expenditure Survey (CES) conducted by the National Sample Survey Organisation. The survey is designed to collect information on the consumption spending patterns of households, both urban and rural, across the country. The weights for the current CPI series are based on the CES conducted in 2011-12, with a reference period of July 2011 to June 2012.
Data are collected on expenditures incurred for frequently purchased items — edible oil, eggs, fish, meat, vegetables, fruits, spices, beverages, processed foods, pan, tobacco and intoxicants — during the last seven days; for clothing, bedding, footwear, education, medical (institutional), durable goods, during the last 365 days; and for all other food, fuel and light, miscellaneous goods and services including non-institutional medical services, rents and taxes, data relate to the last 30 days. This data is used to arrive at the consumption expenditure of states for both rural and urbal areas.
Weights to each state are assigned on the basis of its consumption expenditure as a share of the overall consumption expenditure of the country. Maharashtra has the maximum weight at 13.18 per cent followed by Uttar Pradesh. Similar assignment of weight is done for rural and urban areas across each state. These weights and the prices of items collected from the designated markets across the country are then used to arrive at the national inflation figure.
Radhika Pandey is a consultant at National Institute of Public Finance and Policy.
Views are personal.
Also Read: India’s GDP growth slowed to 6.3% in Q2 — why this isn’t as worrying as it sounds