The Ministry of Statistics and Programme Implementation released the findings from the Household Consumption Expenditure Survey (HCES) conducted in 2022-23. The survey which is conducted once every five years presents estimates of the households’ monthly per capita consumption expenditure. It further indicates the average expenditure of households on various goods and services, including both food and non-food items.
Since the findings of the survey conducted in 2017-18 were junked with the government citing quality issues with the data, this is the first survey released after 11 years which presents insights on the state of consumption of the Indian households.
The survey is essential as it will potentially be used for revising the item basket and their weights in the Consumer Price Index (CPI). The ministry is conducting another round of the survey to verify the findings of the first round. Ideally, the revision in the CPI weights should happen only after the findings of the second round are released.
The survey also sheds light on the efficacy of the government policies in lifting the income and consumption levels of households.
Also read: How India’s GDP grew by 8.4% in Q3, propelled by strong performance in industrial & services sectors
Rural consumption grew faster than urban in nominal terms, in real terms the growth in consumption is roughly 3%
The survey shows that during the period 2011-12 to 2022-23, rural consumption grew at a faster pace compared to urban consumption. While rural consumption rose 2.64 times, urban consumption rose 2.45 times. This translates into a compounded annual growth of 9.2 percent for rural and 8.5 percent for urban households. However, when seen in real terms, the growth in consumption eases to 3.1 percent and 2.7 percent for rural and urban households, respectively.
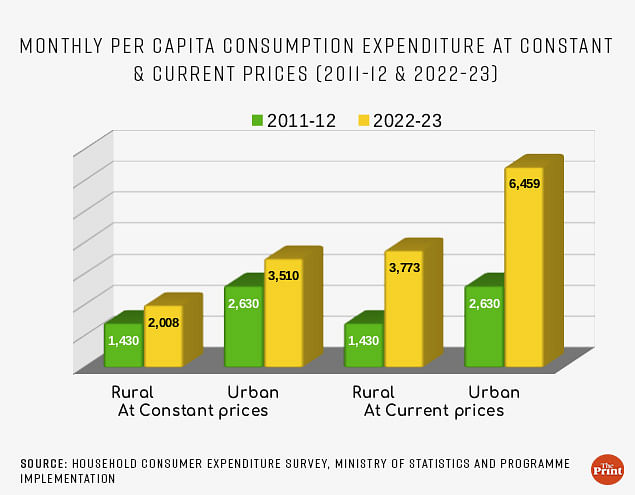
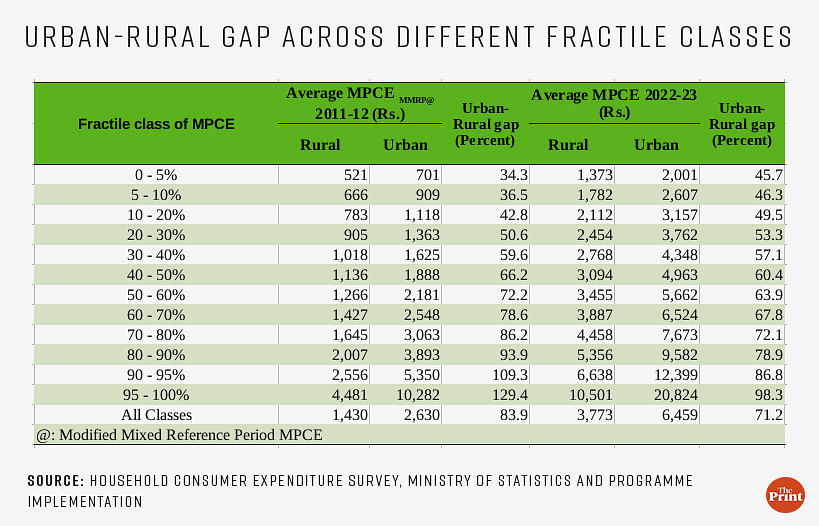
The gap between urban and rural consumption has narrowed during this period, which is a welcome sign reflecting broad-based growth. The difference between the average rural and urban consumption as percentage of rural consumption declined to 71 percent in 2022-23 from 84 percent in 2011-12. However, when disaggregated by consumption levels, there are notable disparities in the urban-rural consumption gap. The gap between consumption levels of rural and urban households is narrower at the lower levels of consumption, implying the effectiveness of government policies in improving rural incomes at the lower end of the pyramid. Significant differences however exist between urban-rural consumption for the top 10-20 percent of households.
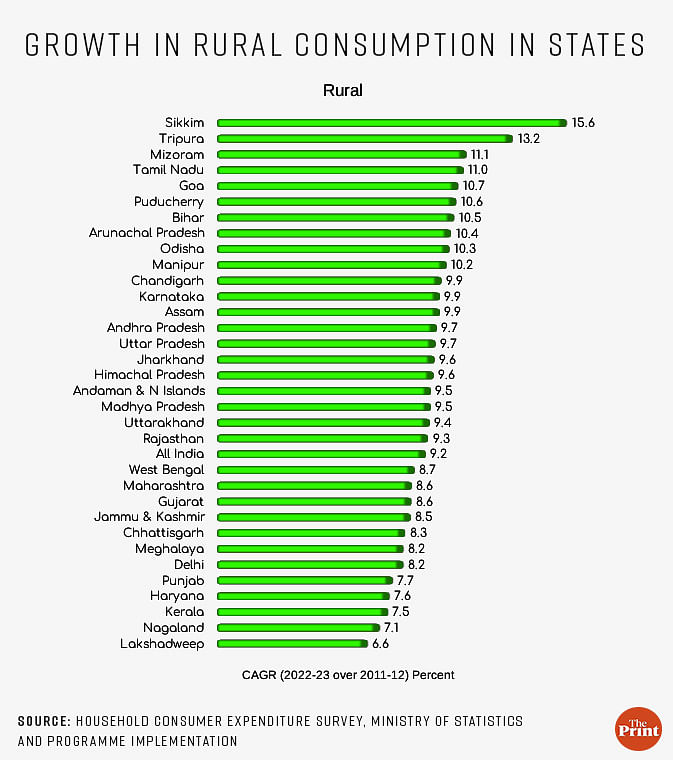
Among the major states, growth in rural consumption is led by Tamil Nadu, Bihar, Odisha, Karnataka, Uttar Pradesh and Andhra Pradesh. Notably, the prominent agri-led states like Punjab and Haryana have seen a relatively slower growth in rural consumption from 2011-12 to 2022-23.
Growth in urban consumption is led by Bihar, Tamil Nadu, Odisha and Gujarat.
Decline in share of food with tilt towards fruits, milk & processed foods
Typically, as economies grow, the pattern of consumption tends to shift from necessities (primarily food) to items of discretionary consumption. The consumption survey shows this trend for both urban and rural households. Over the last decade, the share of food in the consumption expenditure of households has fallen from 53 percent to 46 percent for rural households and from 43 percent to 39 percent for urban households. Correspondingly, the share of non-food items has risen for both rural and urban segments.
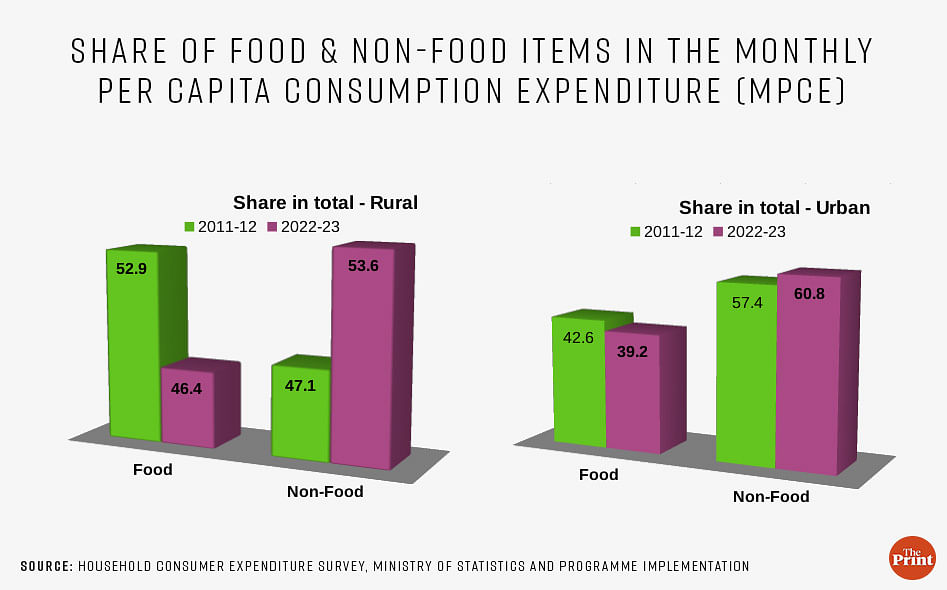
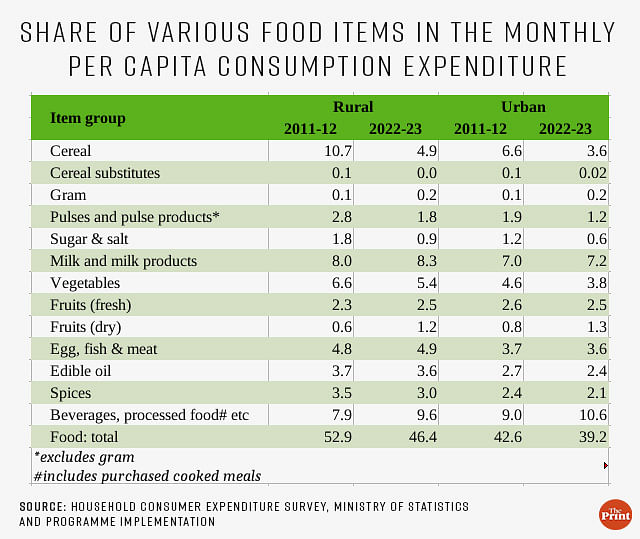
Interesting patterns are visible within the food basket for rural and urban households, indicating the changing preference of households. An interesting finding is that the share of cereals in the overall expenditure has fallen for both rural and urban households — the decline is more pronounced for rural households, from 10.7 percent to 4.9 percent over the last decade.
The share of vegetables, pulses and spices has also seen a decline. There is a shift towards milk and milk products, fruits and processed foods. Notably, inflation in cereals and vegetables has been far ahead of the headline inflation during this period, so any attempt at recalibration of the Consumer Price Index basket based on the recent consumption expenditure should lead to an easing of inflation.
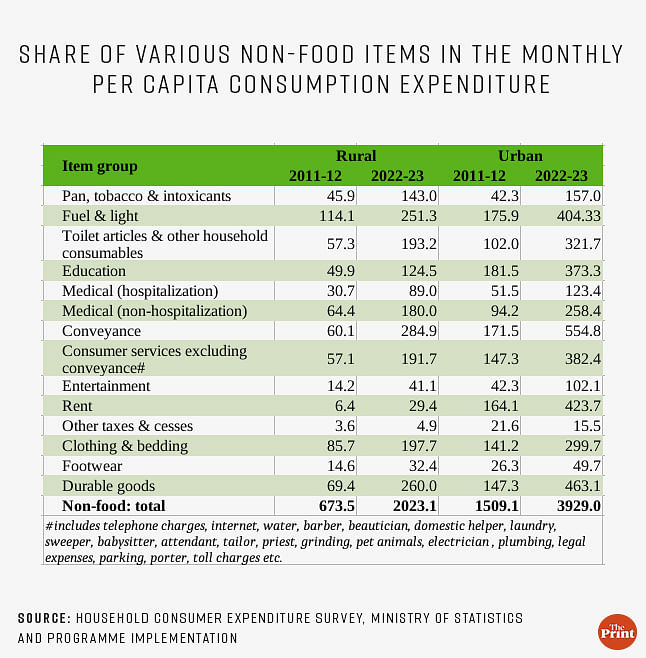
In the non-food segment, while the share of conveyance and durable goods saw the sharpest rise in the monthly per capita consumption expenditure of households, the share of clothing and bedding declined. There is also a greater shift in spending towards consumer services. While the decline in the share of education is puzzling, the share of expenditure on medical, excluding hospitalisation, increased over the last decade.
Over a longer time, the shift in households’ preferences towards discretionary items from necessities and staples might hold lessons for local companies who manufacture necessities.
Impact of welfare programmes on consumption
In addition to the standalone estimates of monthly per capita consumption expenditure, the survey also presents another set of estimates of monthly consumption expenditure including the imputed value of items received free of cost through various social welfare programmes.
Surprisingly, after including the impact of state support, the monthly per capita consumption expenditure rose by Rs 87 for rural areas and Rs 62 for urban areas. This seems to be an underestimation and may not have fully captured the impact of free food grain distribution, LPG cylinders and free power by various state governments.
On expected lines, the impact of the welfare programmes is highest for the bottom 20 percent of the households, ranked by monthly per capita expenditures and tapers off for the households at the upper end of the pyramid.
Among the food items, the impact of the welfare schemes has led to increase in expenditure on cereals from Rs 185 to Rs 267 in rural areas and from Rs 235 to Rs 294 for urban areas.
CPI weights & the MPCE shares
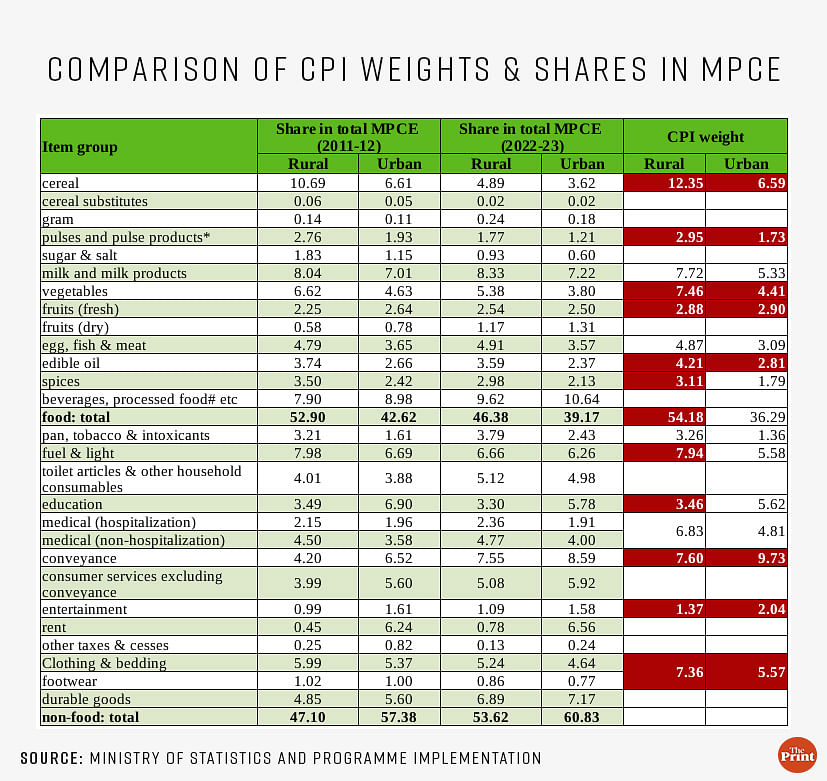
At present, the commodity basket and their respective weights in the CPI are broadly based on the findings of the Household Consumer Expenditure Survey of 2011-12. The findings on the share in MPCE from the recently released survey differ considerably from the weights of commodities in the CPI basket.
CPI places a higher weight on food as compared to the findings from the Household Consumer Expenditure Survey (HCES). For instance, in CPI, food has a share of 54 percent for rural India, but the survey tells us that rural households spend 46 percent of their monthly consumption expenditure on food. Similar differences exist for urban households as well.
Among the food items, the biggest disconnect between the recent survey findings and the CPI is seen for cereals. The revamped CPI based on the recent survey findings, after the conclusion of the second round would much better represent the state of inflation in the country.
Radhika Pandey is associate professor and Rachna Sharma is a Fellow at National Institute of Public Finance and Policy (NIPFP).
Views are personal.
Also read: Subdued growth in household consumption & rural sales but companies optimistic of gradual pick-up


