India’s industrial output measured by the Index of Industrial Production (IIP) posted a robust growth of 10.3 percent year-on-year in August 2023. This was a sharp jump from 6 percent growth recorded in the previous month. The upsurge in growth was broad-based, with the manufacturing sector — accounting for 77.6 percent of the overall index — growing by more than 9 percent.
The other two components of the IIP by economic activity — mining and electricity — also posted strong double-digit growth in August.
According to the use-based classification of IIP, infrastructure and construction goods recorded the highest growth, driven by strong infrastructure push by the government. The production of consumer durable goods, which was in the contraction zone in the last two months, also registered a growth of 5.68 percent in August.
Improved production of consumer durables reflects a revival in domestic demand.
While the year-on-year growth numbers were boosted by the low base, on a sequential basis also, IIP registered a growth of 1.71 percent after seasonal adjustment.
The strong headline numbers, however, mask the weakness in output of a number of segments in the manufacturing sector.
Data for August shows that 40 percent of the manufacturing basket registered growth which was even below that in the same month of the base year, 2011-12. There could be multiple reasons behind the slowdown in production — subdued export demand, deflation, obsolescence of certain components, particularly post Covid, and possibly data issues with regards to the sample set of factories used to arrive at the IIP estimates.
An essential first step towards assessing the reasons for slowdown is to analyse the volume-value mix of the items in the manufacturing basket.
Value-based items are measured in money (rupee) value, instead of production volume. Typically, if Wholesale Price Index (WPI) based inflation declines, the production of value-based items will show a moderation. This will then impact the headline IIP numbers.
Also read: How inclusion of Indian bonds in global indices could unleash potential of India’s financial market
Anatomy of the IIP series
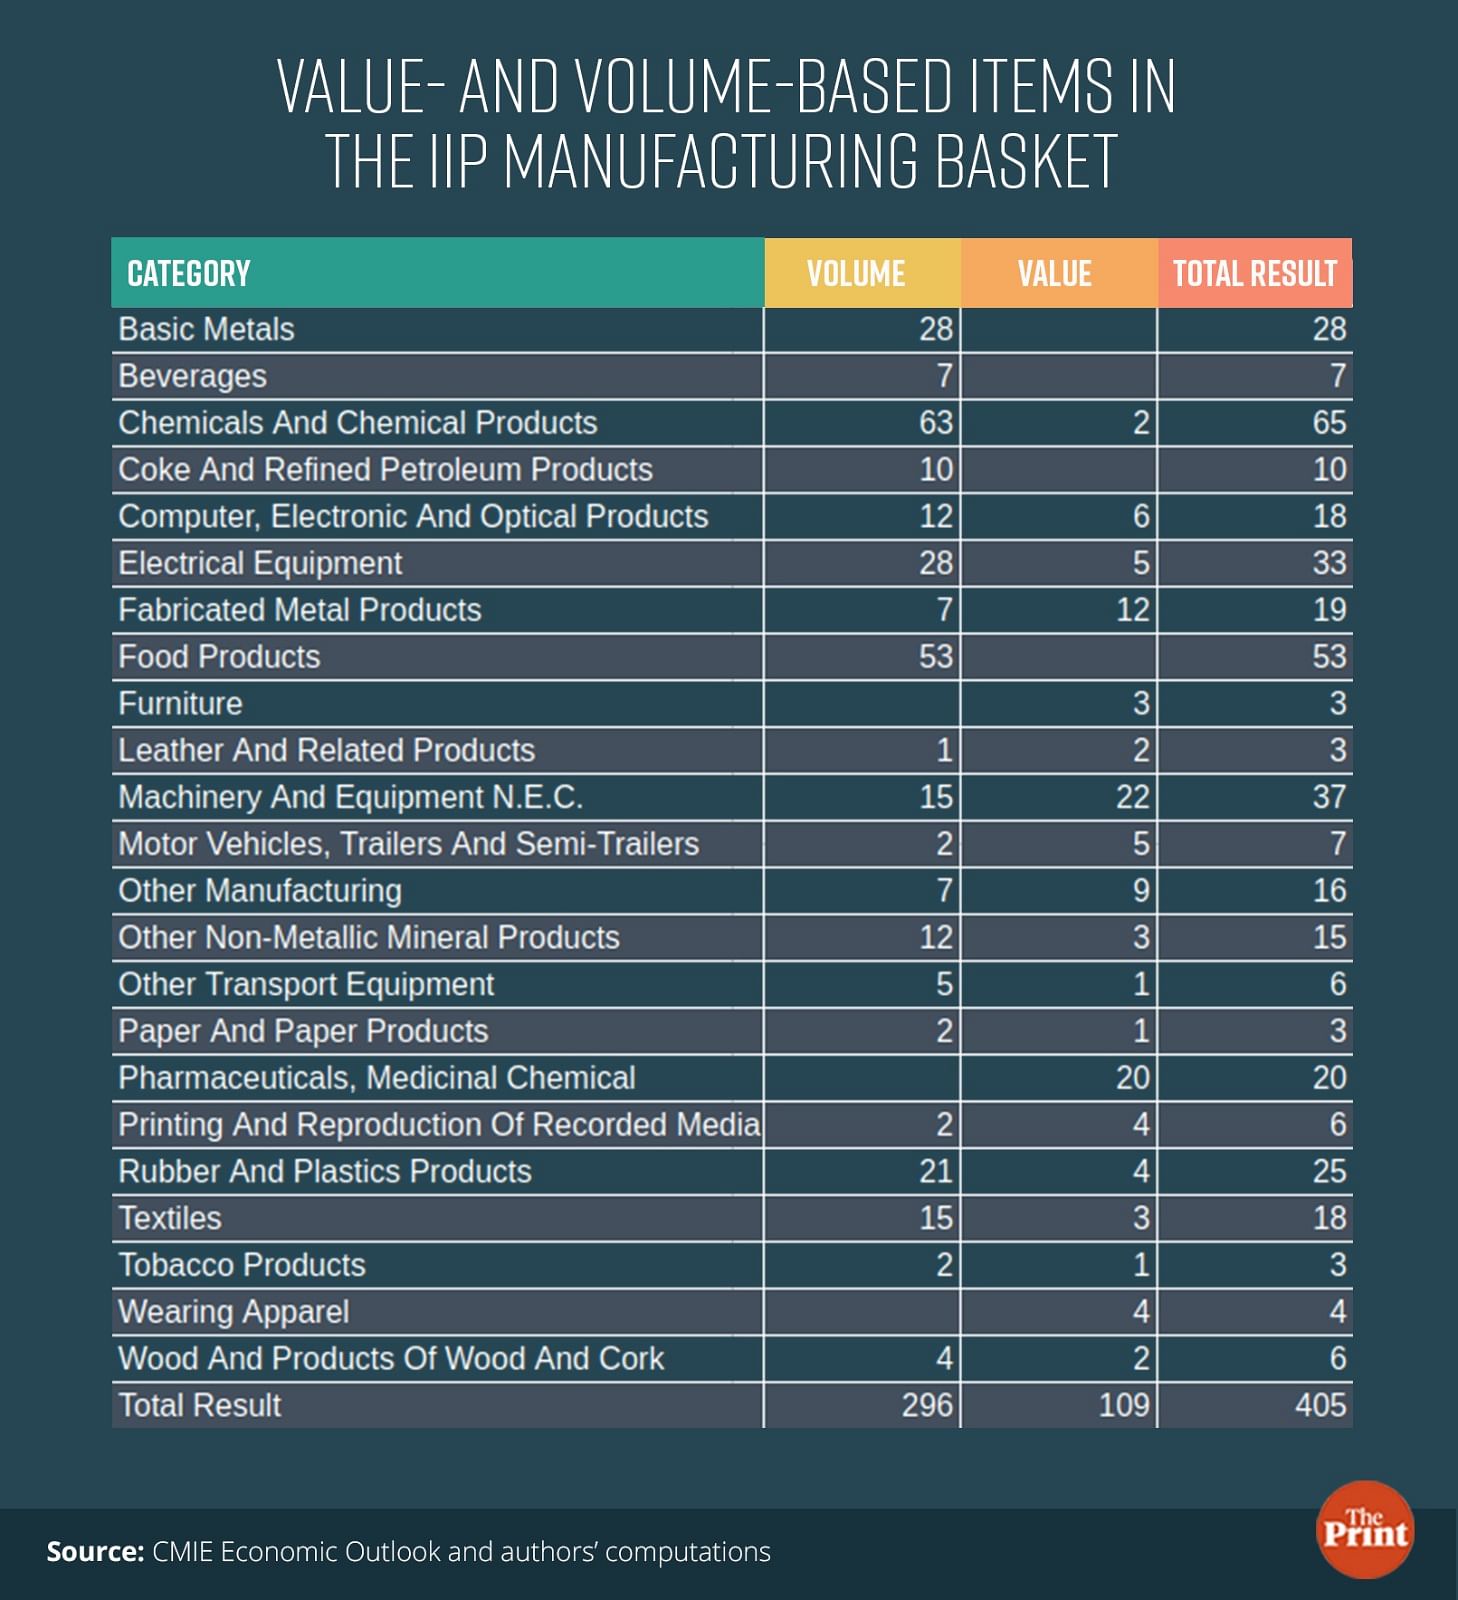
There are 23 commodity groups within the manufacturing sector, covering 405 items. Of which, 296 items are volume-based and 109 are value-based.
Table shows the distribution of value and volume-based items in the manufacturing basket. There are some groups which only include items that are volume-based. For instance, all the 28 items in the basic metals segment are volume-based.
There are some other categories that are predominantly volume-based. For instance, of the 65 items in the category of chemicals and chemical products, 63 are volume-based while two are represented in value terms.
In contrast, categories like machinery and equipment and pharmaceuticals are predominantly value-based. The production of items in the value-based categories would be influenced by the trajectory of prices.

Segments whose production is below the base year production
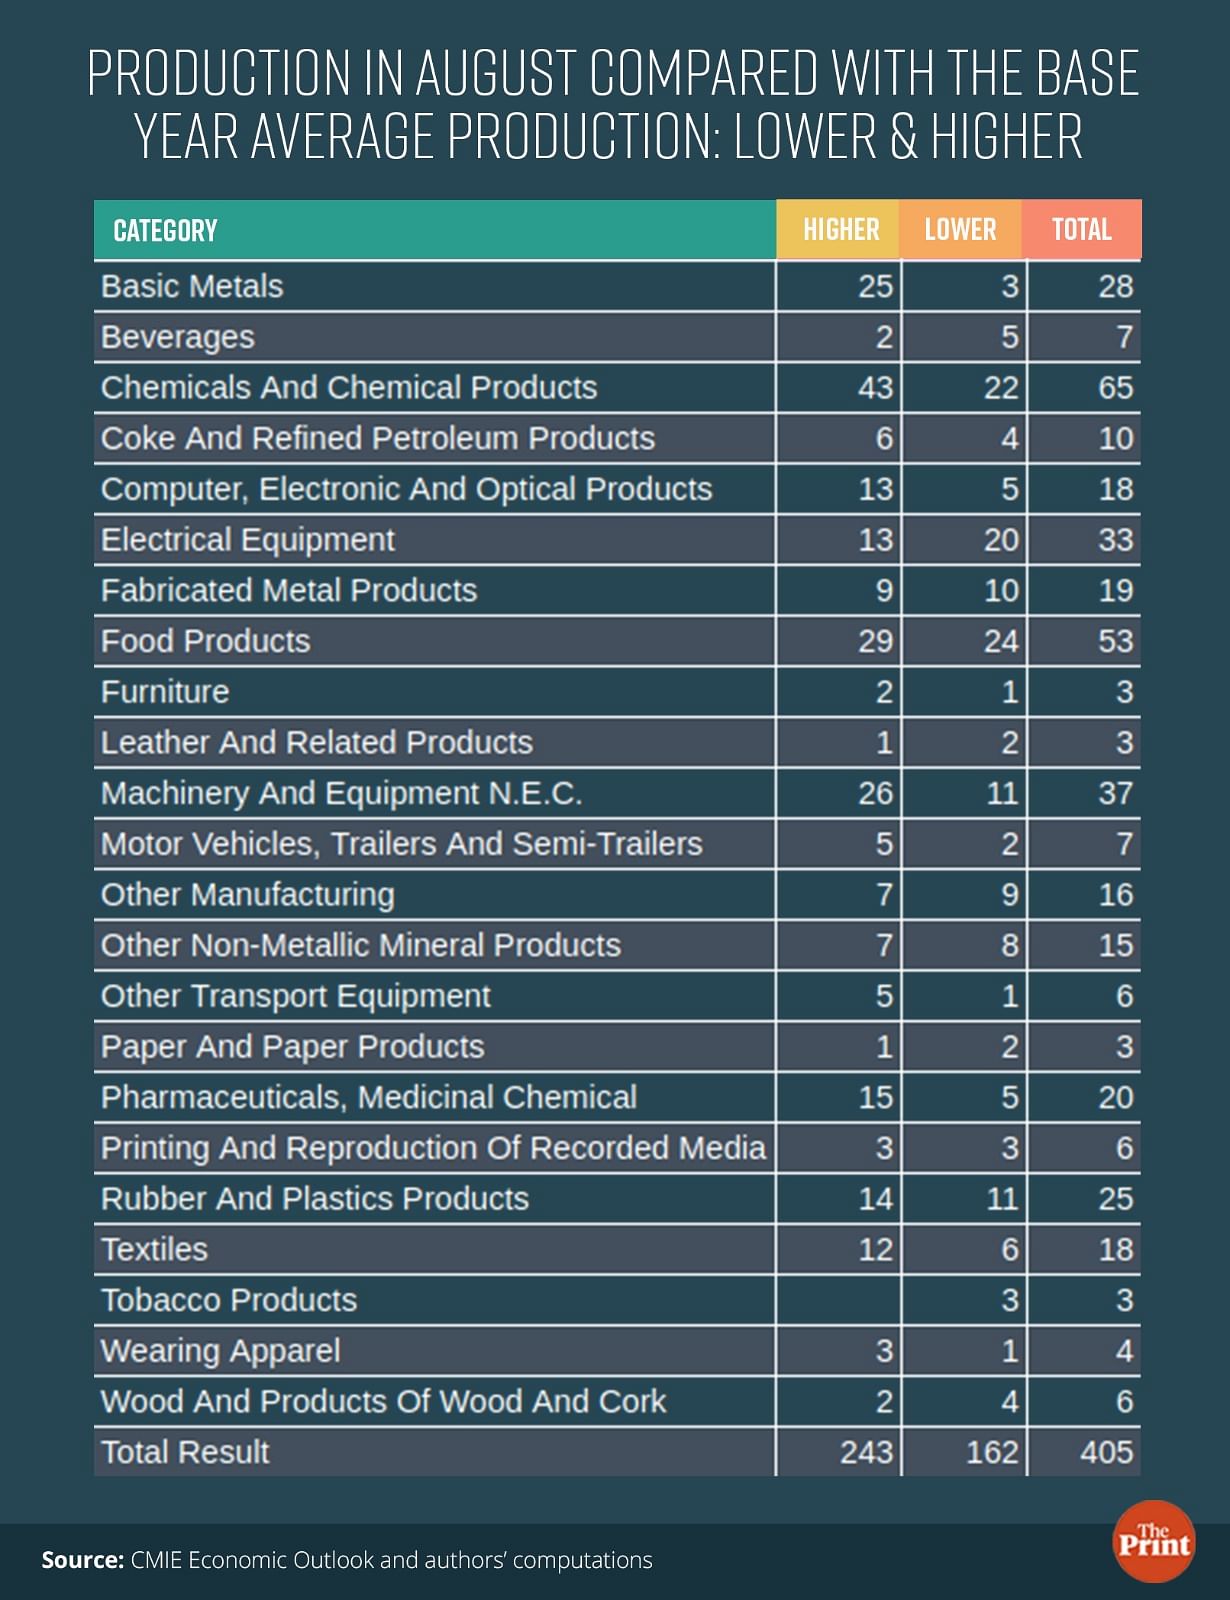
Of the 405 items in the manufacturing basket, production of 162 items was lower in August, 2023, as compared to the average production in the base year.
The table below shows the distribution of such items within the broad category. Of the 65 items in the chemicals and chemical products category, 22 items reported production lower than the base year. This is notable as chemicals and chemical products have a sizable weight (of 7.87 percent) in the manufacturing basket.
Machinery and equipment, electrical equipment, rubber and plastic products and textiles are some of the other segments with a significant number of items that reported production lower than the base year’s average.
Besides, there are other categories which have a comparatively smaller presence in terms of the number of commodities in the overall manufacturing basket. For instance, in the tobacco segment, there are three items and all three items reported a slowdown in production below that of the base year.
Another example is paper and paper products. Of the three items, production of two was lower than that in the base year.
In the labour-intensive leather and leather products segment, of the three items, two reported a slowdown in production, below the levels seen in the base year. Specifically, the two items with lower production are tanned leather and footwear.
While the decline in production in some segments and items such as paper products may be because they have turned obsolete, the decline in production of footwear below the base year is puzzling.
In the textiles sector, a prominent labour-intensive sector, six out of the total 19 items reported lower production in August compared to the base year. The sector as a whole had reported a contraction in production since June 2022. The last two months saw a modest pick up in production of the textile sector.
On the other hand, in the basic metals segment which has the highest weight of 12.8, only 3 of the 25 items registered a production lower than that in the base year. All the items in the basic metal segment are expressed in physical units.

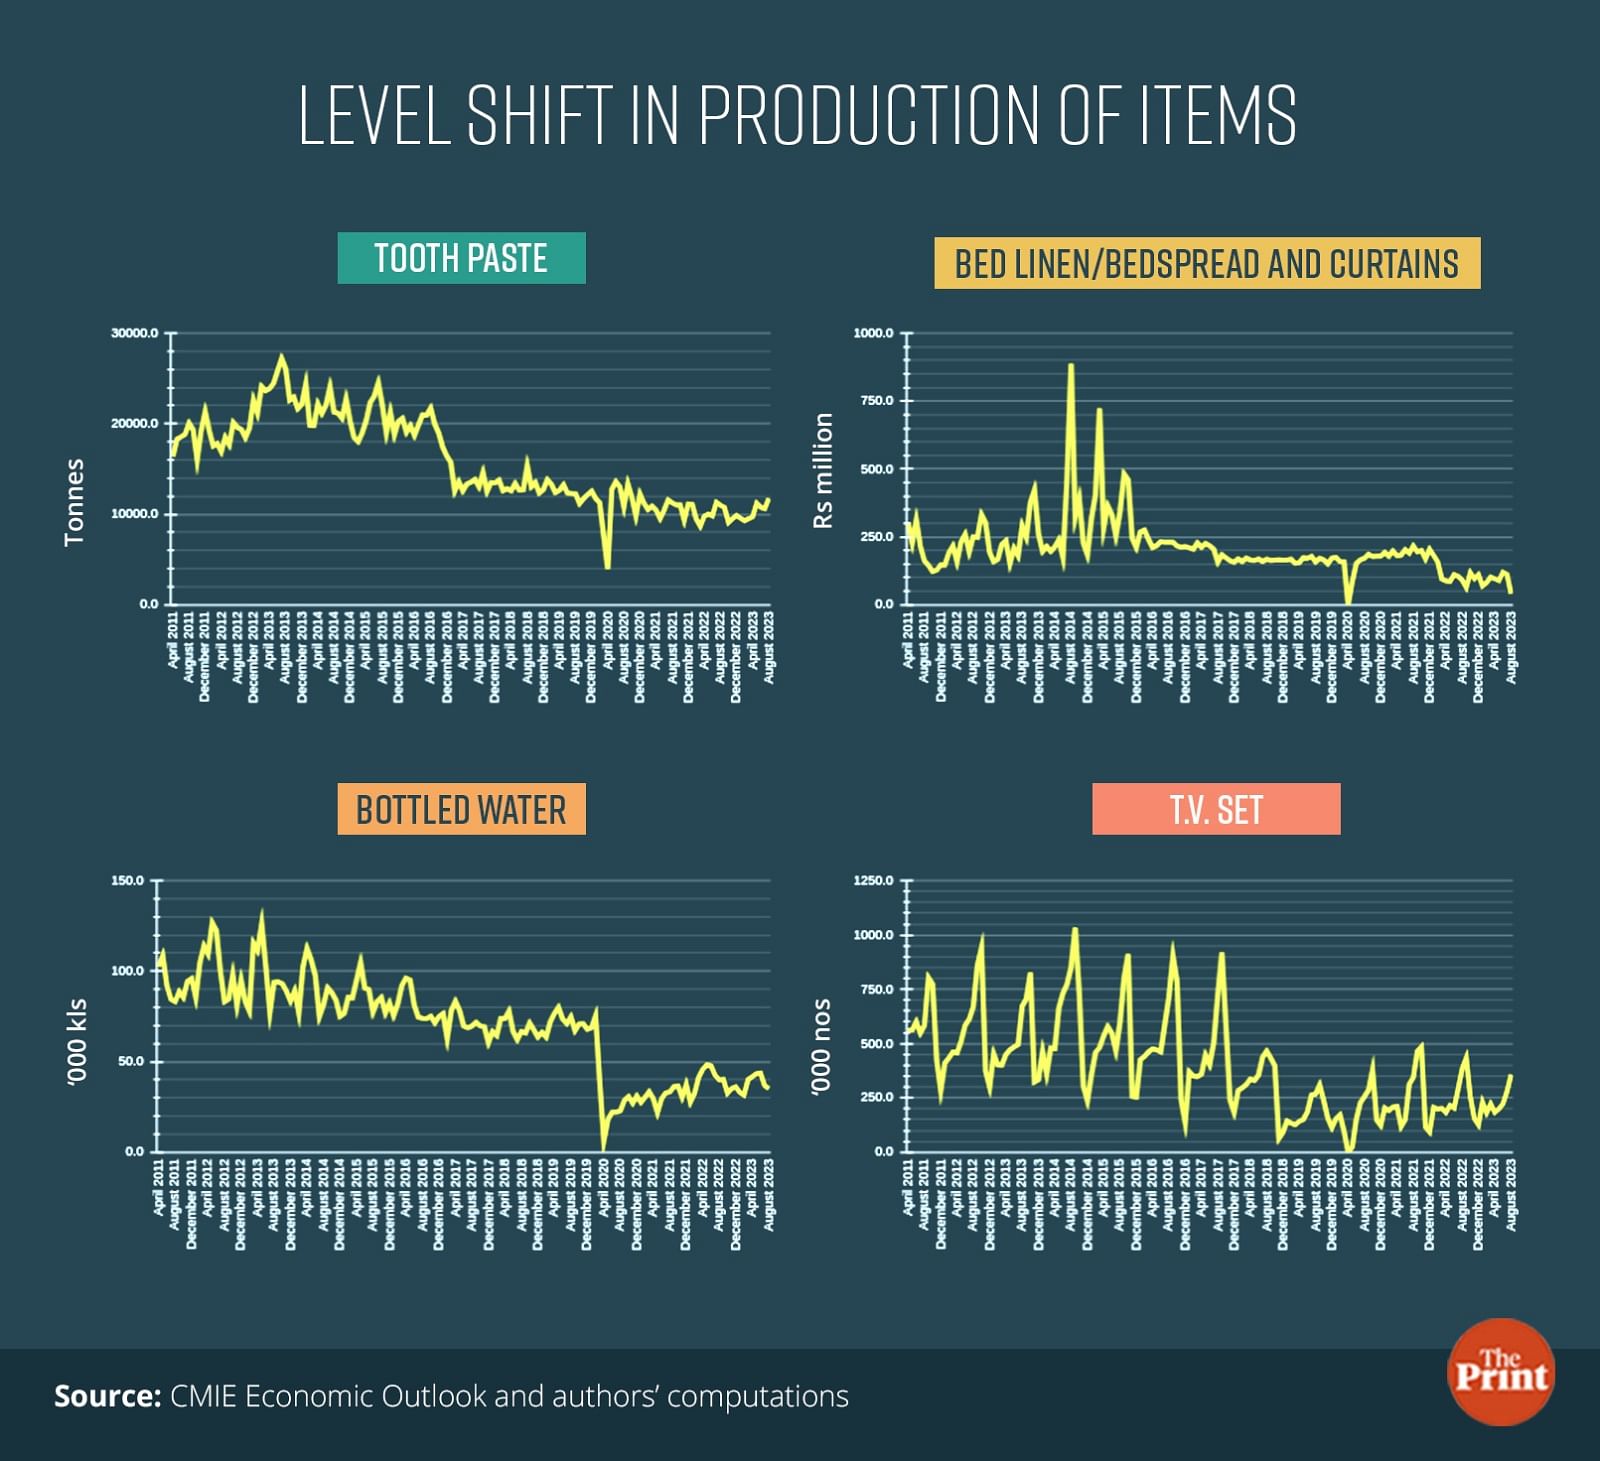
For some items, the scale of decline as compared to the base year average is small, but there are a few where the decline in production is of the order of 70-80 percent. Further, some of the decline in production in a particular month could be explained by seasonal variations but in some instances, production has fallen to less than half of what it used to be in 2011-12. Such instances require closer scrutiny. This possibly also warrants a re-look at the coverage of the production units and other sources of production data.
Figure below shows a significant decline in production of a few items of common use. While Covid led to a visible dip in production, for some of the items, the reasons for slowdown in production are not restricted to the pandemic. For instance, the decline in the production of toothpaste and bed linen started much before the pandemic. The steep decline in production in items of common consumption warrants a closer scrutiny including a revisit of the data collection methodology.

Radhika Pandey is an associate professor and Pramod Sinha is a Fellow at the National Institute of Public Finance and Policy (NIPFP).
Views are personal
Also read: India remains fastest-growing big economy in FY24 but Israel-Hamas war could hurt govt’s fiscal math


