


New Delhi: ThePrint brings you a daily tracker, which traces Indian states and union territories on Covid-19 — an extensive record of how much each state/UT is testing, how quickly the infection is spreading and whether the positivity rate is increasing.
For this analysis, we are using three parameters:
Rt value, known as the reproduction number, is the average number of people who can be infected by a single case. If the Rt value is less than 1, it suggests that the outbreak of the virus is in control. The WHO has recommended this metric as an important measure for quantifying the rate of spread of the virus.
Positivity rate indicates the percentage of Covid-19 tests conducted that turn out to be positive. A low positivity rate suggests that testing levels are sufficient.
Tests per million are the number of tests being conducted in proportion to the population of a particular area. They give insight into whether states or UTs are conducting sufficient testing.
All data is sourced from covidtoday.in and the maps below show figures for worst-performing states under each parameter.
Also read: 582 deaths, 63.24% recoveries, Gujarat mortality rate highest at 4.74% — India’s Covid data
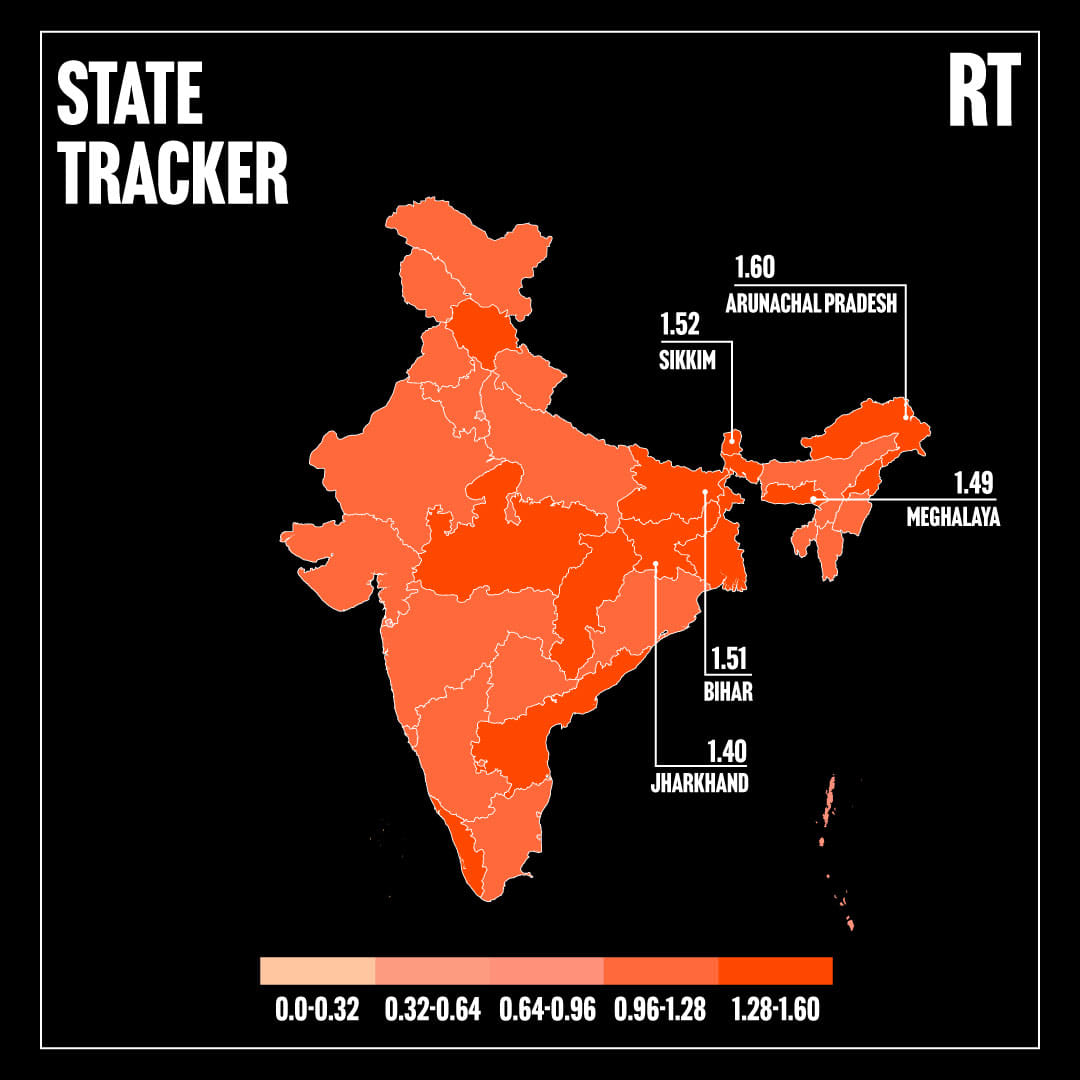
Rt value
As of 16 July, India’s average Rt value stands at 1.14. The lowest Rt values in the country were recorded in Andaman and Nicobar Islands (0.88), followed by Delhi (0.89), Dadra and Nagar Haveli and Daman and Diu (0.93) and Mizoram (0.97). A day before, on 15 July, there were only two union territories that had recorded an Rt value of less than 1, namely Delhi, and Andaman and Nicobar Islands.
The highest Rt value, on 16 July, was recorded in Arunachal Pradesh (1.60). The second highest was seen in Sikkim (1.52), then Bihar (1.51), Meghalaya (1.49) and Jharkhand (1.40). However, Meghalaya seems to have improved its Rt value from 2.37 Wednesday to 1.49 Thursday. But Sikkim’s Rt value has gone up — from 1.49 Wednesday to 1.52 Thursday.
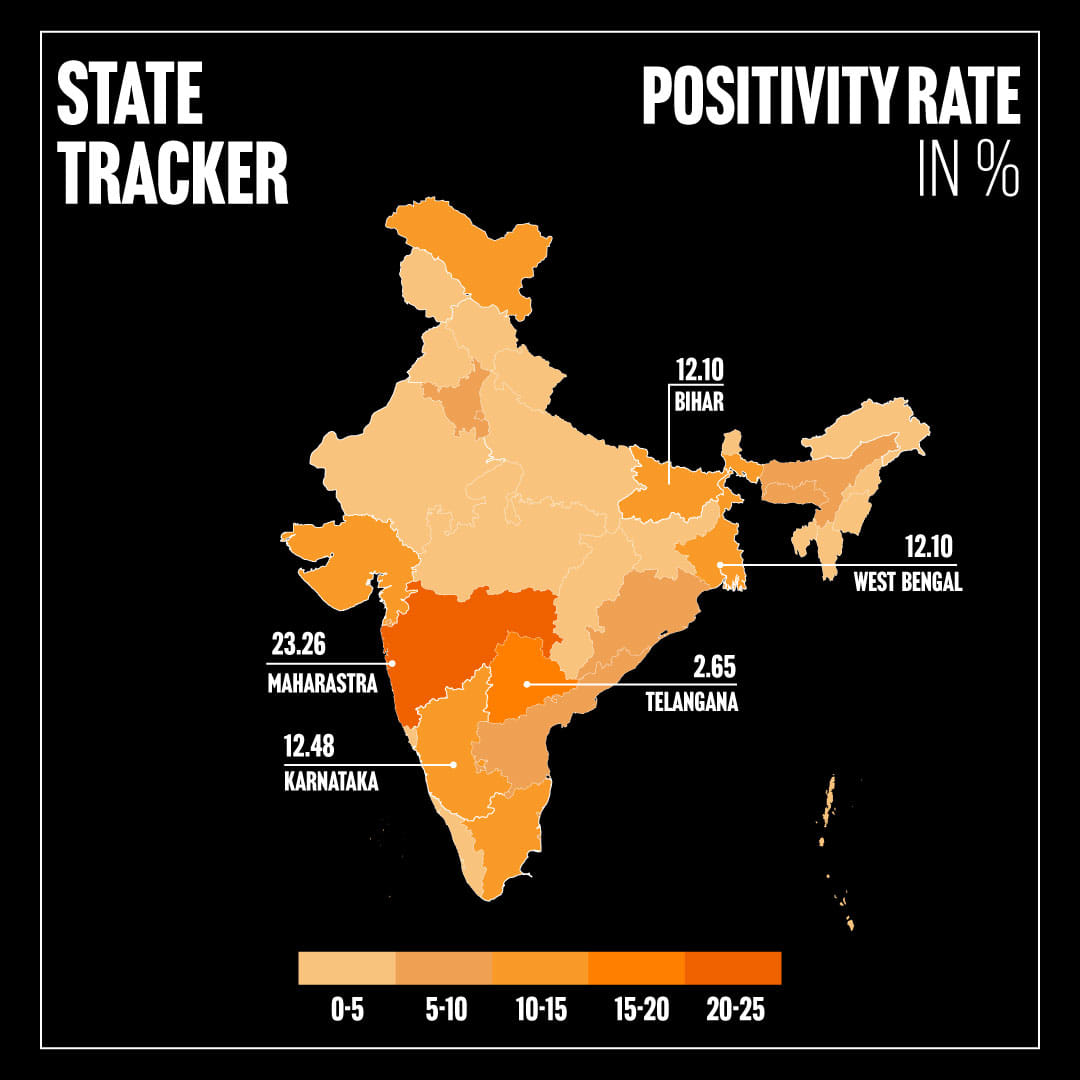
Positivity rate
The average positivity rate in India is 10.02 per cent as of 16 July. In an ascending order, the lowest positivity rate was recorded in Himachal Pradesh (1.98 per cent), Kerala (2.07 per cent), Andaman and Nicobar Islands (2.65 per cent), Manipur (2.70 per cent) and Rajasthan (2.78 per cent). Himachal Pradesh and Kerala’s positivity rate has increased since 15 July by 0.16 per cent and 0.12 per cent, respectively. Manipur has made an improvement in its positivity rate — from 3.42 per cent on 15 July to 2.70 per cent on 16 July.
The highest positivity rate in the country has been recorded in Maharashtra at 23.26 per cent as of 16 July, which is more than double the country’s average. Telangana has recorded the second highest positivity rate at 15.26 per cent. These are followed by Karnataka (12.48 per cent), West Bengal (12.10 per cent) and Bihar (11.80 per cent).
Maharashtra has recorded an increase in positivity rate — from 23.11 per cent on 15 July to 23.26 per cent on 16 July. However, Telangana’s positivity rate has decreased, from 17.55 per cent on 15 July to 15.26 per cent on 16 July. While Karnataka has recorded an increase of positivity rate by 0.82 per cent since 15 July.
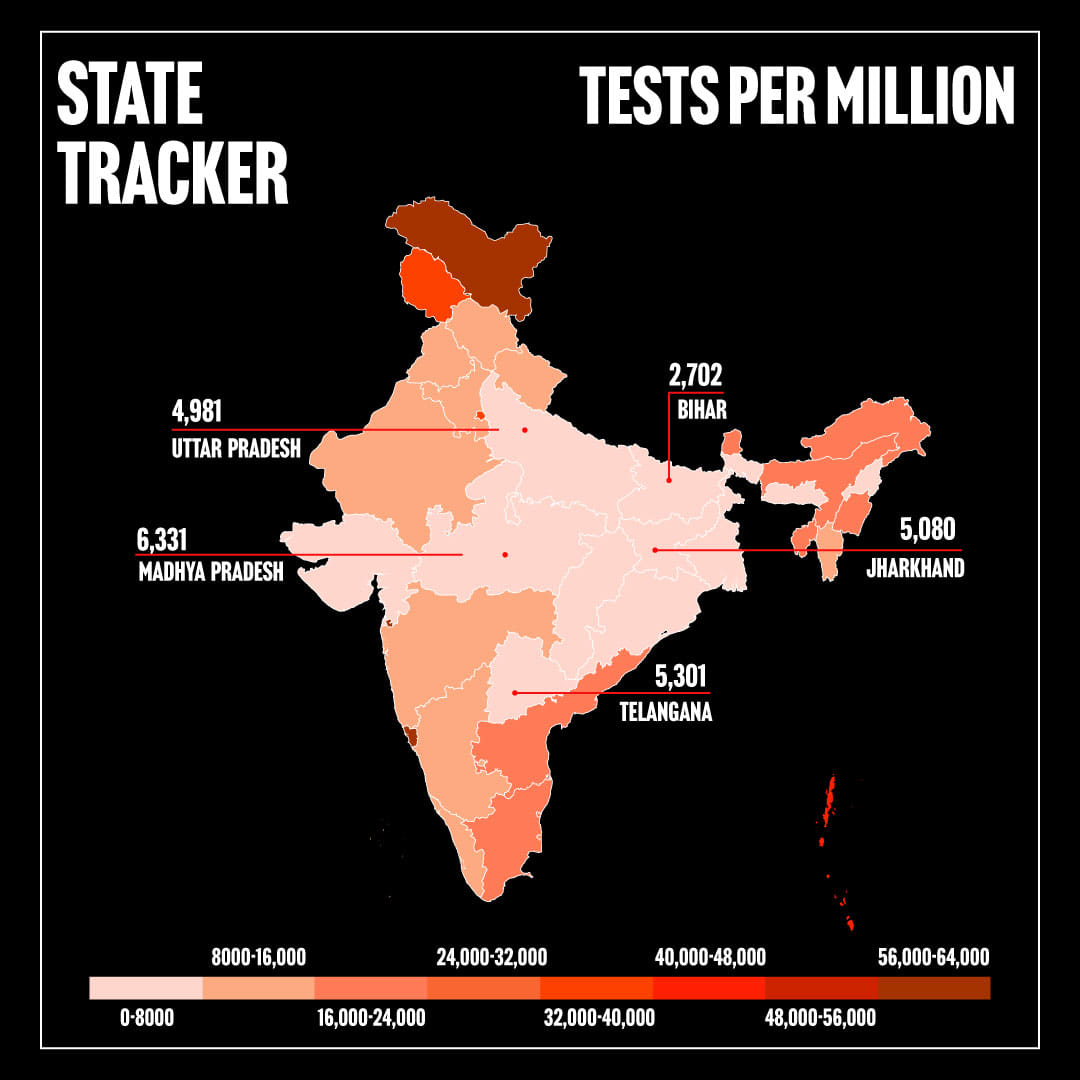
Tests per million
The average tests per million value in India stands at 9,289 as of 16 July. States that have recorded the lowest tests per million are — Bihar (2,702), Uttar Pradesh (4,981), Jharkhand (5,080), Telangana (5,301) and Madhya Pradesh (6,331). The tests per million recorded for Uttar Pradesh as of 15 July is same as 16 July. Jharkhand increased its test per million — from 4,919 on 15 July to 5,080 on 16 July.
Goa has recorded the highest tests per million in the country with 62,558 on 16 July. Other states/UTs that have conducted high tests per million (in descending order) are Dadra and Nagar Haveli and Daman and Diu (59,937), Ladakh (53,985), Andaman and Nicobar Islands (45,281), Delhi (39,358) and Jammu and Kashmir (34,847).
Goa increased its test per million from 60,956 on 15 July to 62,558. Delhi has also ramped up its test per million from 38,174 on 15 July to 39,358 on 16 July.
Also read: Bihar has lowest Covid tests per million in India, Maharashtra’s positivity rate the highest