


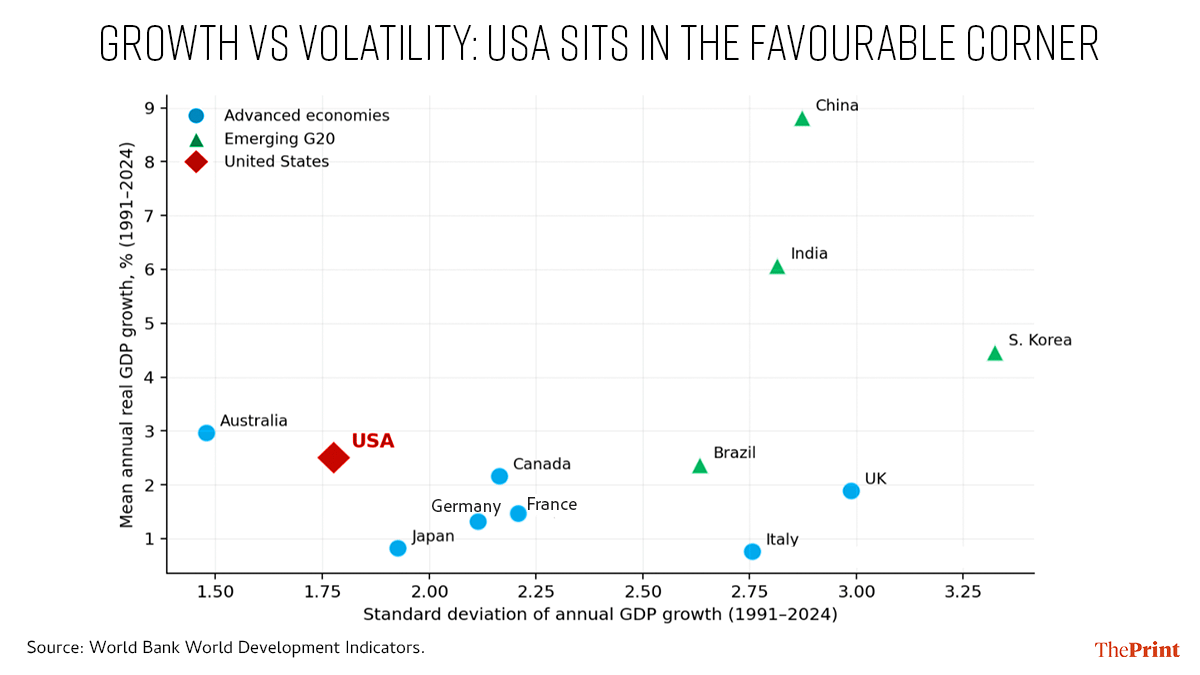
America’s remarkable growth metrics stand out
The chart displayed above shows three clusters. Continental European economies cluster around 1.3-1.5 percent mean growth with standard deviations of 2.1-2.2. Italy and the UK show both lower mean growth and higher volatility. The emerging G20 economies sit at higher mean growth but with materially higher volatility.
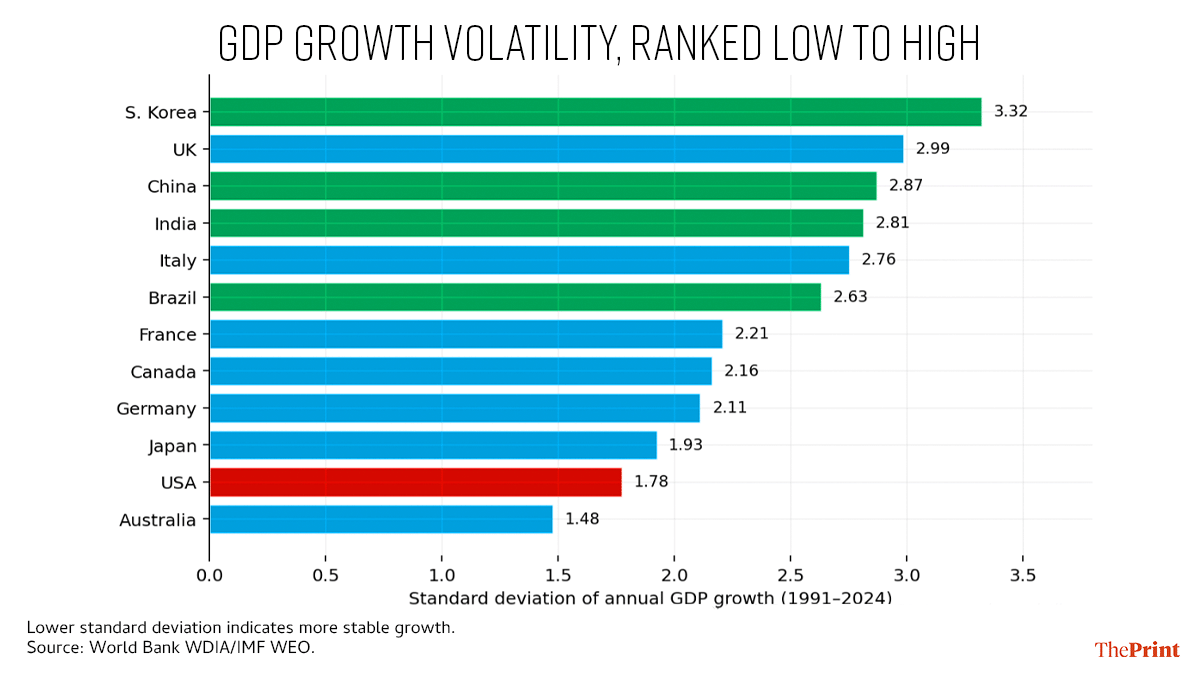
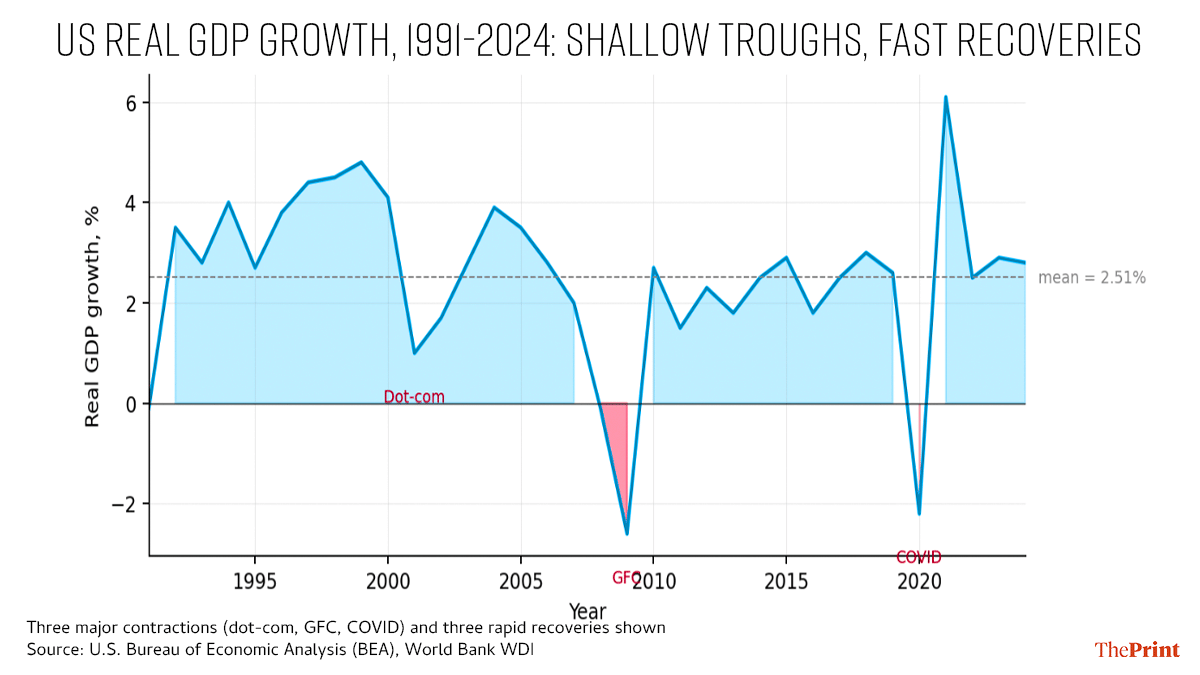
The US sits roughly on its own: 2.51 percent mean growth with 1.78 standard deviation. Only Australia has lower GDP volatility, and Australia achieves this partly by virtue of not experiencing a recession during 1992–2019, a function of riding the China commodity super cycle rather than internal resilience.
Leaving aside long data runs, even if we focus on specific episodes of pronounced crisis, America excels in recovering rapidly from crisis.
The COVID-19 shock provides the cleanest natural experiment in modern data. Every major economy experienced the same exogenous shock at the same time. The differences in 2020 contractions and 2021 rebounds reveal the underlying resilience properties of each economy.
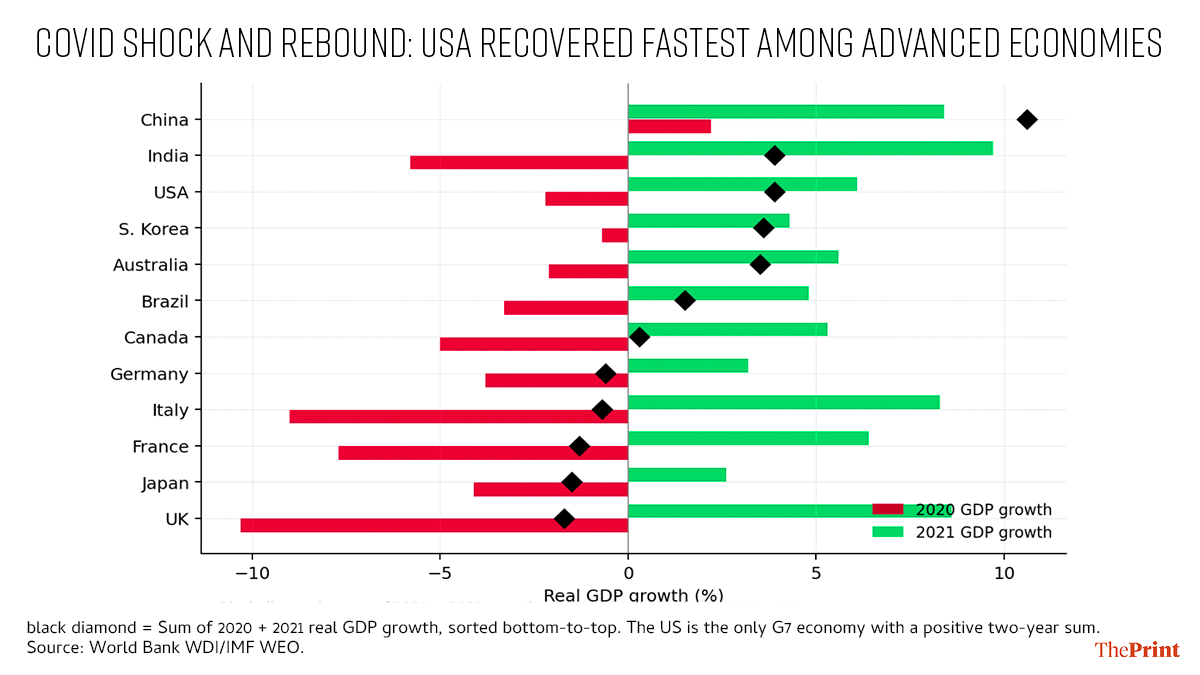
The US 2020 contraction was −2.2 percent, against −10.3 percent for the UK, −9.0 percent for Italy, −7.7 percent for France. The 2021 rebound was 6.1 percent for the US. The two-year sum is +3.9 percent, making the US the only G7 economy with a net positive growth outcome from the pandemic shock. China and India also posted positive two-year sums, of +10.6 and +3.9 percent, respectively.
The post-GFC (Global Financial Crisis) unemployment recovery shows a similar asymmetric pattern. The number of years required for unemployment to return to its 2007 pre-crisis level was 10 for the US, 8 for the UK, 12 for France, 11 for Canada and 15 for Australia. Italy and China had not returned to their 2007 unemployment levels by 2024. Germany never exceeded the 2007-level.
So why is the US economy so resilient?
1. Labour-market flexibility & weakened unions
The US has the lowest employment protection legislation (EPL) strictness index in the OECD outside Anglosphere peers. At-will employment is the default in 49 of 50 states. There are no statutory severance requirements for most workers, no works councils with co-determination rights, and private-sector union density is approximately 6 percent, down from 25 percent in 1973 and against approximately 35 percent in Germany and 70 percent in the Nordic countries.
The empirical consequence is that US firms reduce headcount quickly during downturns, restore profitability rapidly, and rehire quickly during recoveries. European firms hoard labour, often with state subsidy, producing lower headline unemployment during crises but slower productivity recovery and persistent zombie firms. The US unemployment rate fell from 14.7 percent in April 2020 to 3.5 percent within 26 months, the fastest labour-market recovery from a major recession in modern history.
The de-unionisation of the US private sector was deliberate. The Volcker recession of 1979–82 destroyed approximately 2.4 million manufacturing jobs and gutted the industrial union base in a single cycle. The PATCO firings of 1981 set the political tone. Subsequent decades of trade liberalisation (NAFTA 1994, China WTO accession 2001) accelerated the trend.
2. Dollar reserve currency status
The dollar’s reserve-currency role allows the US to issue unlimited debt at low yields during crises. In 2020, the US ran a fiscal deficit of 16 percent of GDP; the eurozone aggregate was 7 percent. The US Treasury could issue approximately $5 trillion of new debt at near-zero yields because every central bank, sovereign wealth fund and major financial institution has a structural need to hold dollar assets. Approximately 58 percent of global foreign exchange reserves are held in dollars.
The European Central Bank (ECB) has no equivalent capacity because the eurozone lacks unified safe-asset issuance. The closest moment was the €750bn NextGenEU recovery fund of 2020, which remains a one-off rather than a permanent instrument. Japan also runs large fiscal deficits but funds them domestically and has paid for it with three decades of near-zero growth.
The practical effect during COVID was that US households received three rounds of direct stimulus payments and an expanded child tax credit. European households received wage replacement via furlough schemes. The US chose a faster real-growth recovery at the cost of higher inflation.
3. Tech-sector dominance
The US has largely captured the entire platform layer of the global digital economy: search (Google), social (Meta), e-commerce and cloud (Amazon), mobile operating systems (Apple, Google), enterprise software (Microsoft, Oracle, Salesforce), and is now capturing the AI compute and model layer (Nvidia, Microsoft, Google, Anthropic, OpenAI). Europe has produced no platform-scale technology company; Japan’s hardware leadership of the 1980s did not transition to software.
Information technology constitutes approximately 35 percent of the S&P 500 index by weight, against approximately 9 percent for the MSCI EAFE (developed markets ex-US and Canada). When AI capital expenditure accelerates, this sectoral concentration compounds into GDP via capital expenditure, equity wealth effects, employment in adjacent sectors, and tax revenue.
4. Demographics and immigration
The US working-age population continues to grow at approximately 0.4 percent annually. Germany, Japan, Italy, South Korea and China are in absolute working-age population decline. Japan’s working-age population peaked in 1995 and has contracted by approximately 14 per cent since. This single factor is estimated to account for an estimated 0.8-1.0 percentage points of trend GDP growth difference between the US and Japan or Germany.
Approximately one-third of US labour force growth since 2010 has come from immigration. Immigration is geographically self-sorting: immigrants move to where labour demand is highest, which provides an additional channel of labour-market clearing. US immigration also selects strongly for working-age cohorts and high-skill flows. Approximately 55 percent of US billion-dollar startups have at least one immigrant founder.
5. Deep, equity-financed capital markets
US firms are predominantly equity- and bond-financed; continental European and Japanese firms are predominantly bank-financed. The consequences are systemic. When the dot-com bubble burst, equity holders absorbed the losses, balance sheets cleaned within 2–3 years, and capital reallocated to new sectors. When Europe experienced the 2011 sovereign-debt crisis, bank balance sheets were impaired, lending froze, and the eurozone experienced a second recession in 2012–13. The US did not double-dip after the GFC.
Venture capital deployment is approximately $170 billion annually in the US against approximately $15 billion in all of Europe combined. US bankruptcy law (Chapter 11) is rehabilitative and fast; European insolvency regimes are slower and more liquidation-oriented. Zombie firms persist longer in Europe and Japan, locking up capital and labour.
6. Federal fiscal architecture as automatic stabiliser
The US federal government is approximately 22 percent of GDP and operates as the principal fiscal counter-cyclical force. When a state economy contracts, federal transfers (unemployment insurance, Medicaid matching, disaster relief) flow automatically without political negotiation. This is a fiscal union in operation.
The eurozone has no comparable mechanism. Asymmetric shocks to Greece, Spain, Italy or Portugal require intergovernmental bargaining and conditional bailouts. The architecture itself amplifies asymmetric shocks.
7. Geographic, energy & resource endowment
The US benefits from a continental-scale internal market with a single currency, single bankruptcy code, single commercial law, and one dominant language. This enables economies of scale that European firms structurally cannot achieve in their home markets, which is why Europe has produced no equivalent of Walmart, Home Depot or Costco.
The shale revolution made the US a net energy exporter by 2020. When Russian gas supply to Europe collapsed in 2022, German chemicals and steel suffered a permanent cost shock while US manufacturing gained share. US Gulf Coast natural gas prices are persistently 30–50 percent below European prices. Energy independence also insulates the US economy from Middle East geopolitical shocks that historically transmitted to recessions via oil prices.
The US is also one of few large economies that is a net food exporter, eliminating an entire category of external shock.
8. Defence-funded R&D & institutional strength
The Pentagon and the Defense Advanced Research Projects Agency (DARPA) run the world’s largest R&D-intensive procurement programme. The internet (ARPANET), GPS, jet engines, semiconductors, touch-screens, voice recognition and foundational machine-learning research were all partly funded through defence budgets. This constitutes approximately $800 billion annually of state-backed industrial R&D in disguise, a scale Europe and Japan deliberately limited after 1945.
Institutional strength on contracts and property rights is harder to quantify but real. The Delaware Court of Chancery is the global benchmark for corporate dispute resolution. The Bayh-Dole Act of 1980 enabled universities to own and license federally-funded research, which underlies the Stanford-MIT startup pipeline.
Federalism creates regulatory competition between states. These factors lower the discount rate on long-duration investment, which compounds the effect of factors like dollar being the reserve currency and deep, equity financed capital markets.
Implications for Indian investors
For an Indian investor whose income, property and other assets are denominated in rupees, US equity exposure provides four distinct benefits, in order of importance:
Diversification away from India-specific risk:
An investor whose entire economic life is concentrated in one emerging market is exposed to governance shocks, currency crises, monsoon-driven inflation, geopolitical events and sectoral concentration within the Indian equity market. An illustrative allocation such as 15–25 per cent to US or global equity reduces total-wealth variance materially. This may be considered a key argument for global allocation, more important than the return argument.
Sector access not available domestically
India has no listed pure-play semiconductor manufacturers, no global software platform companies at the scale of Microsoft or Google, no biotechnology firms at the scale of Pfizer or Eli Lilly, no aerospace primes at the scale of Boeing or Lockheed Martin. The US provides direct exposure to industries that do not exist in India. This argument is structurally stronger than the simple ‘US grows faster’ argument.
Passive currency hedge
The rupee has depreciated against the dollar at approximately 3-4 percent per annum over long horizons, reflecting persistent inflation differentials. A flat-in-dollars US equity return therefore becomes a 3-4 percent return in rupee terms purely through foreign exchange. This should not be over-weighted in the rationale (the relationship can pause for years), but it may act as a structural cushion.
Future foreign-currency goal hedging
Investors with future dollar liabilities such as overseas education for children or international travel can match those liabilities by holding dollar-denominated assets, removing the currency risk on those specific goals.
The authors of this note work for Marcellus Investment Managers (www.marcellus.in) and are the authors of ‘Breakpoint: The Crisis of the Middle Class & The Future of Work’.
(Edited by Tony Rai)
Most points are valid. That said, America’s hegemony is causing global economic problem while they remain protected due to physical distance and vast energy resources.
Take the example of the Iran conflict. USA has started an unnecessary conflict far away from their land and created an energy crisis in Europe and Asia while protecting themselves.