


The southern states do well in terms of Net State Domestic Product. But what happens when one studies per capita income and inequalities?
New Delhi: The Kerala floods have once again ignited the debate on how well-off south Indian states are vis-a-vis their north Indian counterparts and how the south is perhaps better equipped financially to cope with an emergency.
There has been talk comparing the economy of a ‘united South India’ to that of Hong Kong. But are these states collectively really that rich?
The last time such a comparison was possible was in 2014-15, when the government had released comprehensive data for all states and union territories.
Also read: Per capita income, human development rankings puncture holes in India’s GDP rise story
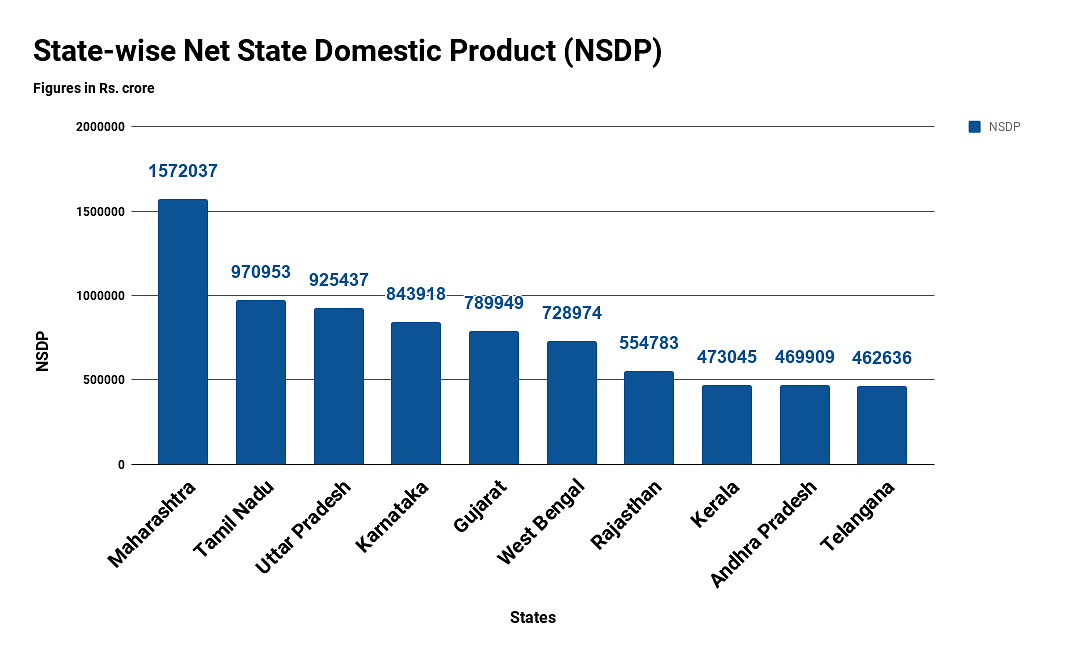
Net State Domestic Product
In terms of Net State Domestic Product (NSDP) — the monetary value of all goods and services produced in the state during a financial year — all five southern states featured in the top 10. Tamil Nadu was second, Karnataka was fourth, while Kerala, Telangana and Andhra Pradesh bagged the eighth, ninth and tenth positions respectively.

Per capita income
In terms of production of goods and services, the southern states do really well. But once per capita income is included in the study, the picture changes.
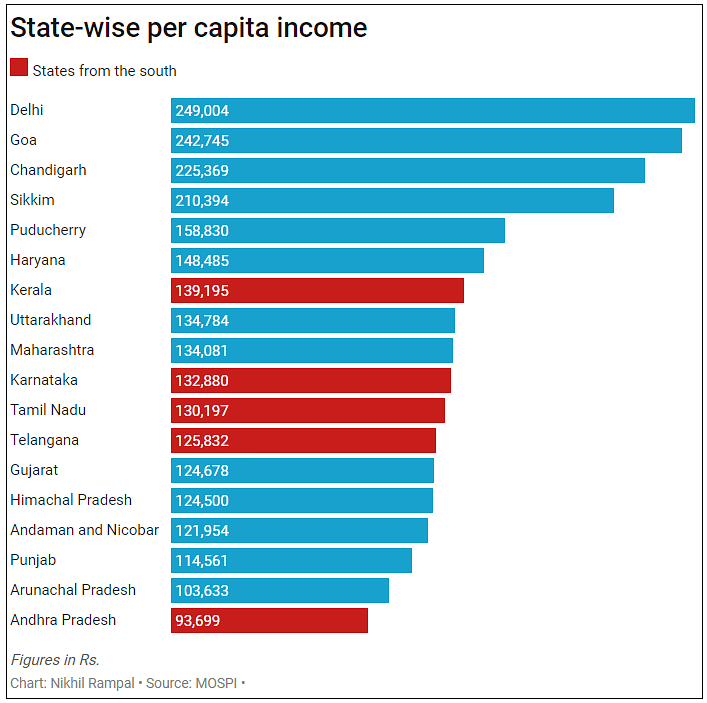

In terms of state-wise per capita income, only two southern states appeared in the top 10, and none in the top five. Kerala came in eighth, Karnataka 10th, Tamil Nadu 11th, Telangana 12th, and Andhra Pradesh 18th.
Income inequalities
The World Bank’s estimates of Gini coefficients paint a poor picture for the southern states. Gini coefficient measures income inequalities as a ratio, with a higher figure representing greater inequality.
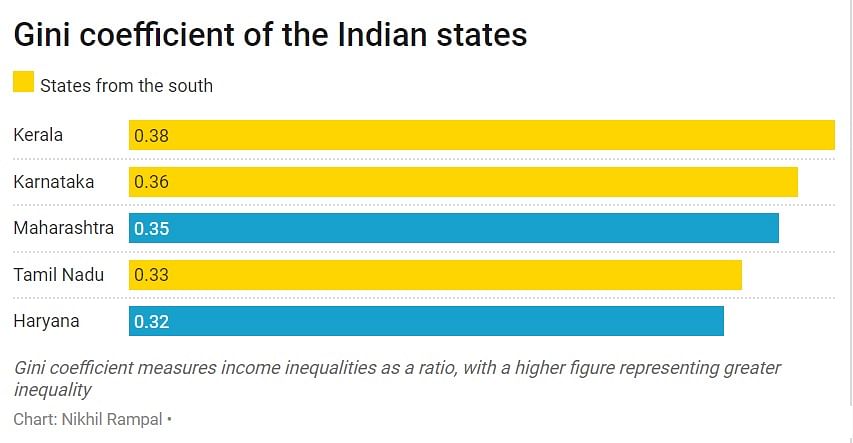

Based on 2011-12 series data, Kerala topped the list with a Gini coefficient of 0.38. Karnataka came in second with 0.36, while Tamil Nadu was fourth with 0.33. All three were worse off than the national average of 0.32.
Also read: For rich South India, the rest of the country is a tax burden
This means that income distribution is very skewed in these high NSDP states. Maharashtra, which topped the NSDP list, showed a similar trend, with the third-highest Gini coefficient, while low production and low per capita income states such as Bihar and Assam showed the lowest coefficients.
Andhra Pradesh’s coefficient was not calculated by the World Bank due to data limitations.