Just how many Indians have died in the second wave of Covid? What would be the eventual toll of the pandemic? This is not idle, morbid, curiosity. The true numbers have momentous humanitarian, public health, economic and political implications.
I have been asking this question for the past few weeks. This was triggered by personal experiences, not very different from what most Indians have gone through recently. In the past two months, I have lost my mentor, another colleague, a batch-mate, several teachers, many comrades in the movement and just too many persons I knew and knew of. I have attended more memorial meetings than I remember in a long time. My own small village in Haryana has lost 19 lives in less than two months. That is what set me thinking: just how big is the scale of this tragedy? I started following media reports and expert analyses besides conducting my own word-of-mouth survey. Everything pointed to a big scandal. But how big? That was unclear.
Last week was a breakthrough. Now, it is clear that we are looking at the biggest death toll caused by any single disaster or epidemic in the last century. It is also clear that the central and nearly all the state governments are sitting over and concealing the numbers. Experts have a clear sense of the scale of this disaster by now, but they are perhaps waiting for more verifiable evidence before they can publish their estimates. Hence my effort to offer a tentative estimate.
Also read: Modi, state government, destiny. Survey asked Indians who they blame for Covid deaths
Why the new data matters
Let us begin with the latest data bomb. Last week, data journalist S. Rukmini published in Scroll the entire data set on the number of deaths in Madhya Pradesh and Andhra Pradesh (and partly on Tamil Nadu) as recorded in the official Civil Registration System (CRS). So, now we have month-by-month break up of the number of deaths officially recorded in these states for each district and smaller units. This data enables us to begin answering the big question.
So far, we have seen shameful images of packed crematoria and dead bodies floating in the Ganga, shocking stories of suppression and distortion of Covid deaths in some cities, data on the huge death toll in select villages. But these anecdotal evidence did not allow us to project the big picture. We have also had attempts by The Economist, The New York Times and academic institutions to offer estimates of the total death toll. But these were clear under-estimates because all of them took the government’s official infection and fatality figures as their starting point.
Rukmini’s data-expose takes us beyond these limitations. First of all, the data set is big and covers the entire states of Andhra Pradesh and Madhya Pradesh. Besides, it allows us to pursue the right approach. Instead of wasting time on meaningless official statistics on the number of persons infected, cured, or dead from Covid, this approach focuses on the number of “excess deaths”. The simple question is: how many excess deaths, over and above the normal number, have we seen during this period? Not all of these “excess” deaths may be due to Covid. As we know, burden on hospitals and shortage of oxygen has caused some additional deaths unrelated to Covid. Yet, it is reasonable to interpret the spike in deaths as caused by the pandemic.
Most importantly, this information is from the most authentic data set, the government’s official register of births and deaths or the CRS. The data set is not perfect. Many deaths are reported after a month or even after a year. And in many states, a significant number of deaths are never reported and recorded in the CRS. But fortunately, we have good official estimates of how big this error is in each state, thanks to the Sample Registration System (SRS), another official arm of India’s robust statistical system. We know that while AP records 100 per cent of its deaths in CRS, the figure is just 78.8 per cent in MP. We can adjust for these deficits in the data.
Also read: Death and journalism: India’s Covid deaths are undercounted, but twice the Partition toll?
The real numbers
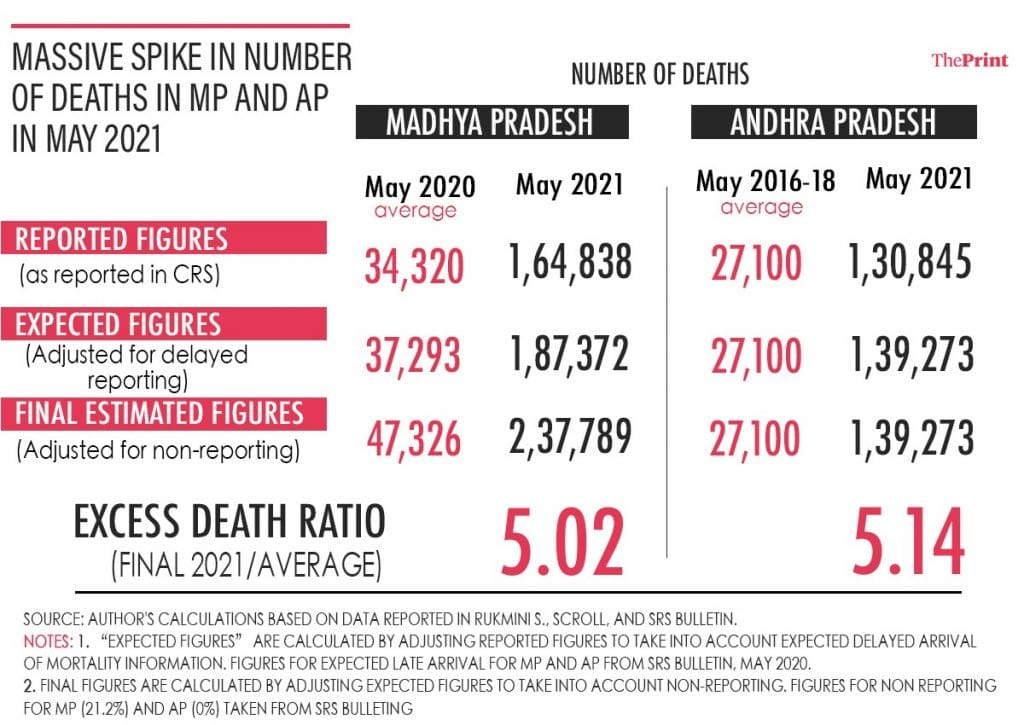
Now let us look at why this data is so shocking. Table 1 presents the figures for the number of average or normal deaths for MP and AP as recorded in the CRS and compares these to the numbers recorded this year in the month of May. The difference is humungous. Madhya Pradesh used to record around 34,000 deaths in May every year. This year it has gone beyond 1,64,000! That is more than 1.3 lakh excess deaths in one state in one single month. Remember, the official figure for Covid deaths in the entire country since March last year is just 3.8 lakhs. In Andhra Pradesh, the numbers jumped from an average of 27,000 to over 1,30,000. In both states, the number of deaths reported is 4.8 times the normal figure.
Table 1

The reported numbers need to be fine-tuned to take into account the expected delays in reporting for both states and non-reporting of some cases in MP. So, in both the states, the final estimated number of deaths would be a little over five times (5.02 in MP and 5.14 in AP) the normal death toll. But that is only for the peak month of May. The data for both the states gives us the numbers for the four months of build-up to the peak. From January to April, the average death toll in MP was 1.4 times the normal.
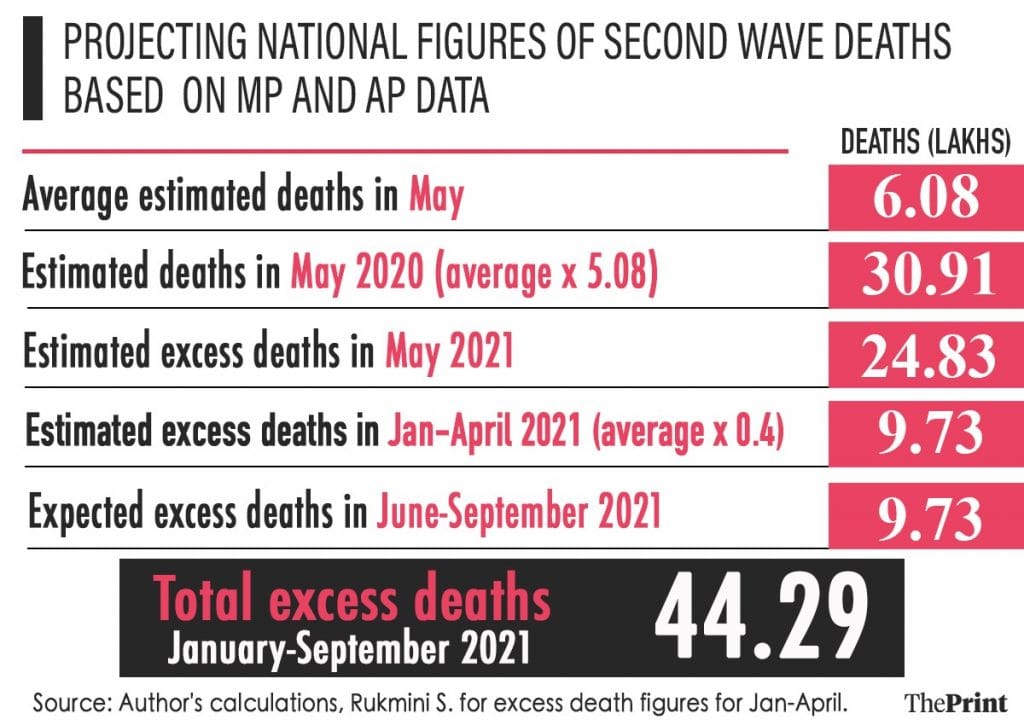
Now let us use this information to project the numbers for the entire country. Table 2 offers this calculation. We take an average of MP and AP and assume that it holds for the rest of the country. That is a big assumption, but not a very risky one. It so happens that both these states are not among the worst or the best states in the country when it comes to spread of Covid and the official reported death rate. If anything, they have reported fewer number of cases and deaths since 1 April, compared to the national average. So we assume here that the death toll in India would have been 5.08 times higher in May this year than the normal monthly count of 6.08 lakhs. That gives us an estimate of 30.9 lakhs, of which 24.8 lakhs are excess deaths, for May. We assume that the graph for the month of January to April would have been similar to MP in the rest of the country, accounting for 0.4 times additional deaths than normal. We also assume that the four months of decline from the peak, from June to September, would also have a similar curve as from January to April. This assumption holds even if the peak in some part of the country was not in May but in April or June. Using this method we estimate nearly 10 lakh deaths on either side of the peak.
Table 2

Add all this up and you have a rough estimate of excess deaths, largely Covid deaths, for the entire country for all nine months of the expected duration of the second wave: 44.3 lakhs. There is nothing final about this number. More data from other states would tell us whether the national average is higher or lower than these two states. More sophisticated modelling will improve the rough estimates offered here. But one thing is sure: we are not talking thousands or single-digit lakhs but millions of deaths. We are looking at more deaths than the numbers recorded in any epidemic or any disaster in India, including the Bengal famine, in the last 100 years, since the Spanish Flu of 1919-20.
The pity is that all this information is sitting on the computers of the home ministry in Delhi that controls the CRS and the SRS. Will the Narendra Modi government stop issuing silly denials and come clean with the entire data on what is clearly the biggest public health scandal of this century?
Yogendra Yadav is the national president of Swaraj India. Views are personal.


