


The National Statistical Office (NSO) has recently released the third annual report of the Periodic Labour Force Survey (PLFS) for the year 2019-20 and also the quarterly estimates for urban areas based on the panel survey of urban households till June 2020. At a first glance, the annual report shows improvements in the employment situation during 2019-20 compared to the reports for the two previous years (NSSO survey years correspond to the agricultural year July to June). This was a little unexpected keeping in mind the severe economic disruption following the spread of the Covid and the overall decline in the GDP growth over the recent years.
In fact, the PLFS report for 2017-18 coming in the wake of the demonetisation shock to the economy had reported a high unemployment rate in comparison to the previous four decades and the estimates were contested. An improved employment situation coming from the recent survey report, encompassing in its last quarter the pandemic impact, has evoked heightened interest in the findings. This note attempts to interpret the numbers reported in the three available PLFS reports. The discussion is limited to the national level estimates of employment and unemployment rates.
Background of the PLFS
Prior to the present PLFS, the then NSSO used to have quinquennial surveys on employment and unemployment (EUS). The first such survey was done during 1972-73 and continued roughly every five years. This survey was conducted along with the household consumer expenditure surveys from which the official poverty estimates were traditionally derived. The last quinquennial survey was conducted in 2009-10 which was repeated in 2011-12 as it was felt that 2009-10 was not a normal year in the face of the global financial crisis. The NSO did not conduct any national level employment surveys after 2011-12 and instead a program of periodic surveys on employment was instituted from 2017-18 with the idea of providing annual and quarterly indicators of employment and unemployment.
There are two types of reports published by the NSO from the PLFS. Data from rural households are collected only once while the urban households form a panel and are visited in three continuous quarters such that one-fourth of the households are replaced every quarter with new sets of households. The main report published annually is based only on the data collected from the first visit for both rural and urban sectors. The panel survey data of urban households are used to produce quarterly reports for the urban sector. The quarterly reports for the urban sector use the current weekly status approach, while the first visit data include both the usual status approach and the current weekly status approach.
As is well known, the usual status uses a long reference period of one year to identify the employment-unemployment status of the respondents. Given a yearlong survey and the moving reference period for the different households surveyed, the results from the annual surveys are indicative of the average situation prevailing during the year. The quarterly reports using a reference period of one week is capable of reflecting the current situation better. This is especially so when the economy is put under stress like the situation after demonetization or the pandemic lockdowns. Unlike in the past when the employment-unemployment situation did not show much change, the events mentioned above are capable of dramatically impacting it. We need to interpret the results of the PLFS in this background. The latest report in fact also covers the period March to June 2020 covering the first wave of the pandemic and the strict nationwide lockdowns enforced by the Government.
Also read: In India’s job market, women have higher exit rate, lower entry rate than men: Study
Employment-unemployment estimates from PLFS
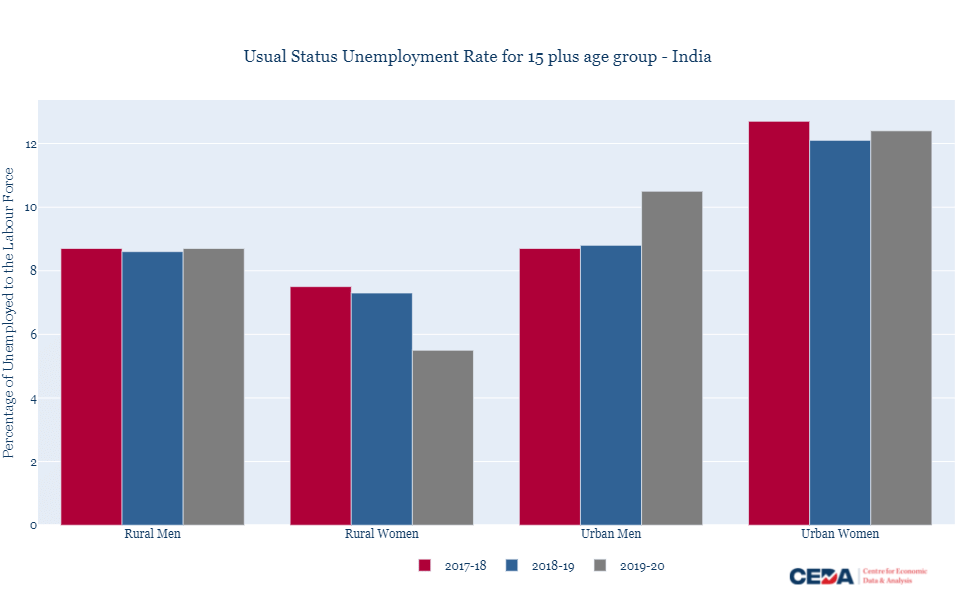
This piece discusses two indicators. The first, Work Participation Rate (WPR) refers to the percentage of workers in the population for a given age group (15 years and above). The other indicator is the Unemployment Rate (UR) which is the percentage of unemployed in the labour force. The labour force in the population is the sum of those working and those seeking work (the unemployed). Therefore, UR is the unutilised portion of the labour force, which in a country like India is determined by a host of economic and non-economic factors.

Table 1b

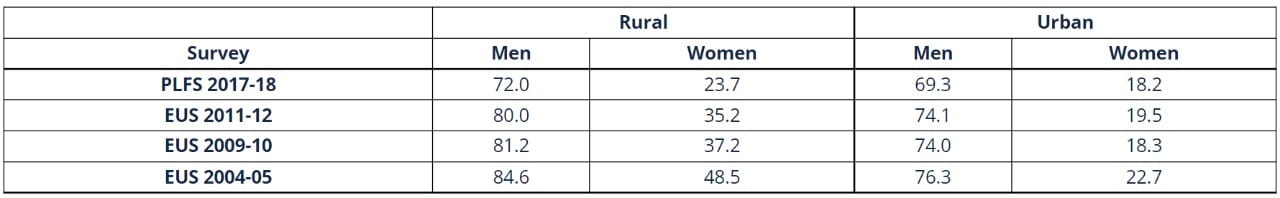
For women, from Table 1b, we see an increase in the WPR both in rural and urban areas, the former around an 8-percentage point jump compared to the post demonetization year 2017-18. For urban areas this works out to a moderate 3-point increase. These numbers for the 2011-12 survey were 35.2 percent and 19.5 percent showing that the WPR for rural women is yet to reach the earlier levels and is not much different from the past urban level.
The significant jump in the WPR for rural women is contributed most by the increase in employment in household enterprises as unpaid family workers. This is a category of women workers on the margins of working and domestic work. There is also an increase in the percentage of casual workers and a small increase of the self-employed women. These categories of employment could be distress driven and not necessarily any improvement in the overall economic activity as that would have shown up in an improved WPR for men in the first instance. It is also noteworthy that the share of employment in the agriculture and allied sector has gone up from 71.1 percent in 2018-19 to 75.5 percent for rural women. The improvement in their WPR has happened due to increased employment in the primary sector. As per the NSO’s provisional estimates of gross value added (GVA) for 2019-20, it is the agriculture sector that showed a robust growth of 4 percent from 2018-19.
For urban women there is an increase in wage employment, which is encouraging with the overall WPR crossing the 2011-12 level of 19.5 percent. The industrial distribution of workforce in the urban sector shows that the share of employment in ‘trade, hotels & restaurants’ have gone up for both men and women in urban areas. For urban men this share is now 28.9 percent compared to 24.5 percent in 2018-19 and for urban women it is 22 percent from 13 percent.
It is well known that most of the employed work in the informal sectors. The informal sector comprises all propriety and partnership establishments. The share of workers employed in the non-agricultural sector working in the informal sector has steadily gone up for rural men from 74.4 percent to 79 percent in 2019-20. For urban women also this percentage has gone up from 51 percent to 54.1 percent (Statement 15, PLFS annual report for 2019-20). Percentage of rural women and urban men employed in the informal sector has remained more or less the same at 59 percent and 66 percent respectively.
Also read: Education levels of SC, ST, OBC rising. A new study looks at caste gap in jobs, income too
The Unemployment scenario
The PLFS reports a reduction in the usual status UR for rural women and an increase in the rate for urban men. For the rural men and urban women, the rate has remained the same as in the previous years. The decline in UR for rural women and the increase for urban men gives a mixed picture. This has received a certain amount of critical attention since the survey covered the lockdown period beginning from the middle of March to June 2020, the closing month of the survey. It is therefore necessary to examine the unemployment rate in the given prevailing economic context.
As noted in the beginning, the PLFS also provides quarterly estimates of employment and unemployment for the urban areas. More importantly the metric used for this part of the survey report is the current weekly status more suitable to measure the current status as the name suggests. As the survey is only for urban areas, a caveat is in order here. Urban employment actually reflects the employment among urban households and not the amount of employment in the urban sector, which includes people coming to urban areas for work without actually being urban residents.
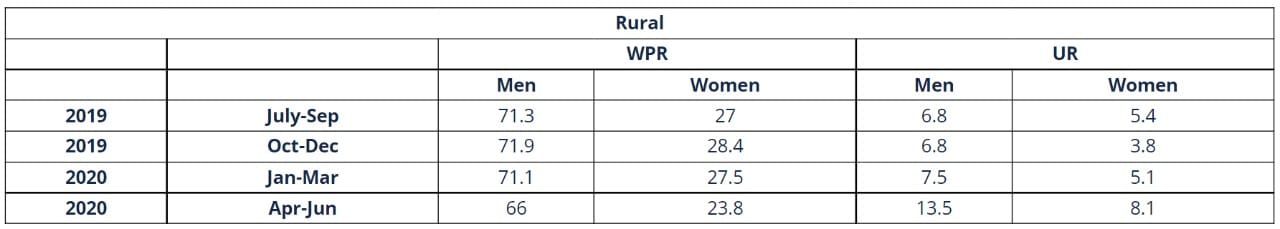
Looking at the series of quarterly estimates from the second quarter of 2018-19 onwards to the third quarter of 2020 (released on 2nd August 2021) in Table 2a, we find that the WPR and UR estimates have remained the same for men till the end of 2019. For women the WPR shows improvement from the third quarter of 2019 and a corresponding decrease in the UR. However, the pandemic impact is visible partly in the first quarter of 2020 and fully in the second quarter for men and women. Possibly the employment situation for urban women was starting to show improvement from the middle of 2019 till the pandemic dashed it. The third quarter data shows improvements in WPR and a fall in the UR, which have not regained their pre-pandemic levels.
Table 2a

We do not have quarterly estimates of WPR and UR numbers for rural areas in the PLFS report. However, using the unit level data, quarter-wise estimates of WPR and UR can be estimated (Table 2b). Unlike in the quarterly reports for urban areas, this uses only the first visit data. We see that as in the case of urban areas, the employment situation got drastically altered in the April-June quarter of 2020. One can also observe the impact of the pandemic and lockdown in March 2020 bringing down the WPR and increasing the UR.
Table 2b
Also read: More young urban Indian men appear to be studying longer, not looking for jobs: New research
Questions on the comparability of PLFS and the EUS
The PLFS 2017-18 estimates had shown a lower WPR (Table 3) compared to the last EUS for 2011-12 and the unemployment rate reported in the PLFS was the highest since the seventies when the EUS were instituted as a regular survey program by the then NSSO. EUS over the years has revealed that the WPR has been declining over the years, quite significantly for women. Besides, the first PLFS was conducted immediately after the demonetization of most of the currency notes in the economy, leading to a severe disruption of economic activities for several months. Thus, both the higher UR and the lower WPR estimates were both not unexpected, but were contested on methodological issues.
Table 3
The methodological questions raised revolved on the criteria used for stratification of households for sample selection. In any statistical survey what matters is the statistical properties of the estimators and the concepts and definitions used. On both these counts the PLFS remains fully comparable to the EUS. As shown in this note the three PLFS surveys have produced consistent numbers. In fact, the estimates from surveys like the Consumer Pyramid Household Survey of the Centre for Monitoring Indian Economy (CMIE) has shown UR quite comparable to that of PLFS. The gap in the employment surveys from 2011-12 to 2017-18 has made it difficult to assess the directions of change in WPR and UR during this period.
Also read: Aadhaar to e-commerce: Data needs to ensure ease of living, not be a burden on Indians
Concluding remarks
Most of the discussions on the recent PLFS are based on the usual status indicators. As noted briefly in the beginning, the usual status with a year as reference period has certain limitations in capturing short period disruptions in the activity status. The methodology to identify the usual status for classifying a person as employed or unemployed also leans heavily on the decision reached by the surveyor after detailed probing. This is unlike the current weekly status followed globally in labour force surveys. The identification of the current weekly status does not leave much discretion to the surveyor as it is based on the response to a precise question. There are other issues when the reference period is as long as a year. Persons having a job but temporarily not working due to the closure of the establishment, as it happens during a lockdown, but expected to start work as soon as the establishment resumes activity are likely to be recorded as employed. The lockdown-like impact on employment may take some time to reflect on the survey responses if one uses the usual status approach.
The improved employment scenario is restricted to women and is due to the increased percentage of rural women reporting in the unpaid family worker category followed by casual worker and self-employed category. Participation in household establishments generally happens as a subsidiary activity to supplement household income generation. Further, the share of employment in the agriculture sector has gone up for women in the rural sector. The share of employment in trade, hotels and restaurants that largely are in the informal sector has also gone up in the urban sector. The slow recovery of economic activity in rural areas following demonetization can partly explain this, possibly starting from the middle of 2018-19 as seen in the urban quarterly estimates of WPR. The quarterly estimates of unemployment rates clearly shows that the short-lived reduction in UR has been dashed by the pandemic starting from the January-March quarter of 2020 Both the WPR and UR have declined considerably in the last quarter of 2019-20 and the recovery in the subsequent quarters is uncertain in the face of the continuing impact and second wave of the pandemic.
The three rounds of PLFS in the period 2017-2020 cover a period when the economic activities got disrupted due to unexpected shocks, unlike the long stable period covered in the past EUS that presented an employment regime showing gradual changes in the structure of the workforce.
The PLFS was intended to provide high frequency indicators for employment. This has not happened as we find that survey results are published after almost a year. Secondly, the quarterly estimates using the current weekly status need to be published for rural areas as well, as estimates based on usual status have limitations during unsettled economic conditions. It is vital that quarterly indicators are released along with the quarterly estimates of other macro aggregates like GDP in order to track the health of the Indian economy in real time.
P C Mohanan is a retired Indian Statistical Service officer and former Acting Chairman, National Statistical Commission. He tweets @pcmohanan. Views are personal.
This article was originally published by the Centre for Economic Data and Analysis (CEDA).