


A common perception regarding Indian politics is that it is the candidate, and not the party, who wins the elections. This makes it important for parties to pick the “right” candidates, and parties in India do spend enormous effort in local consultations and identity arithmetic while choosing who to allocate party tickets to.
The belief that candidates win or lose elections has also led to many more independent candidates throwing their hat into the electoral arena. How do these independent candidates fare?
In this piece, we show the impressive growth over time in the number of candidates, particularly independent candidates, standing for the elections, but also that there is a very small likelihood of an independent candidate actually winning a parliamentary seat. Parties dominate India’s national elections.
More candidates
The number of candidates competing in each Lok Sabha constituency has grown dramatically since Independence, as we show in Figure 1. Here, the grey bean shapes show the distribution of the number of candidates for all the constituencies in that election year. The horizontal black line cutting through the beans represents the average number of candidates across all the constituencies. As we can see in the figure, the average number of candidates who contested for a seat in the 1962 general elections was approximately four, and few places had more than 10 candidates competing for a seat.
Figure 2: Number of Candidates Competing for a Lok Sabha Seat 1962-2015

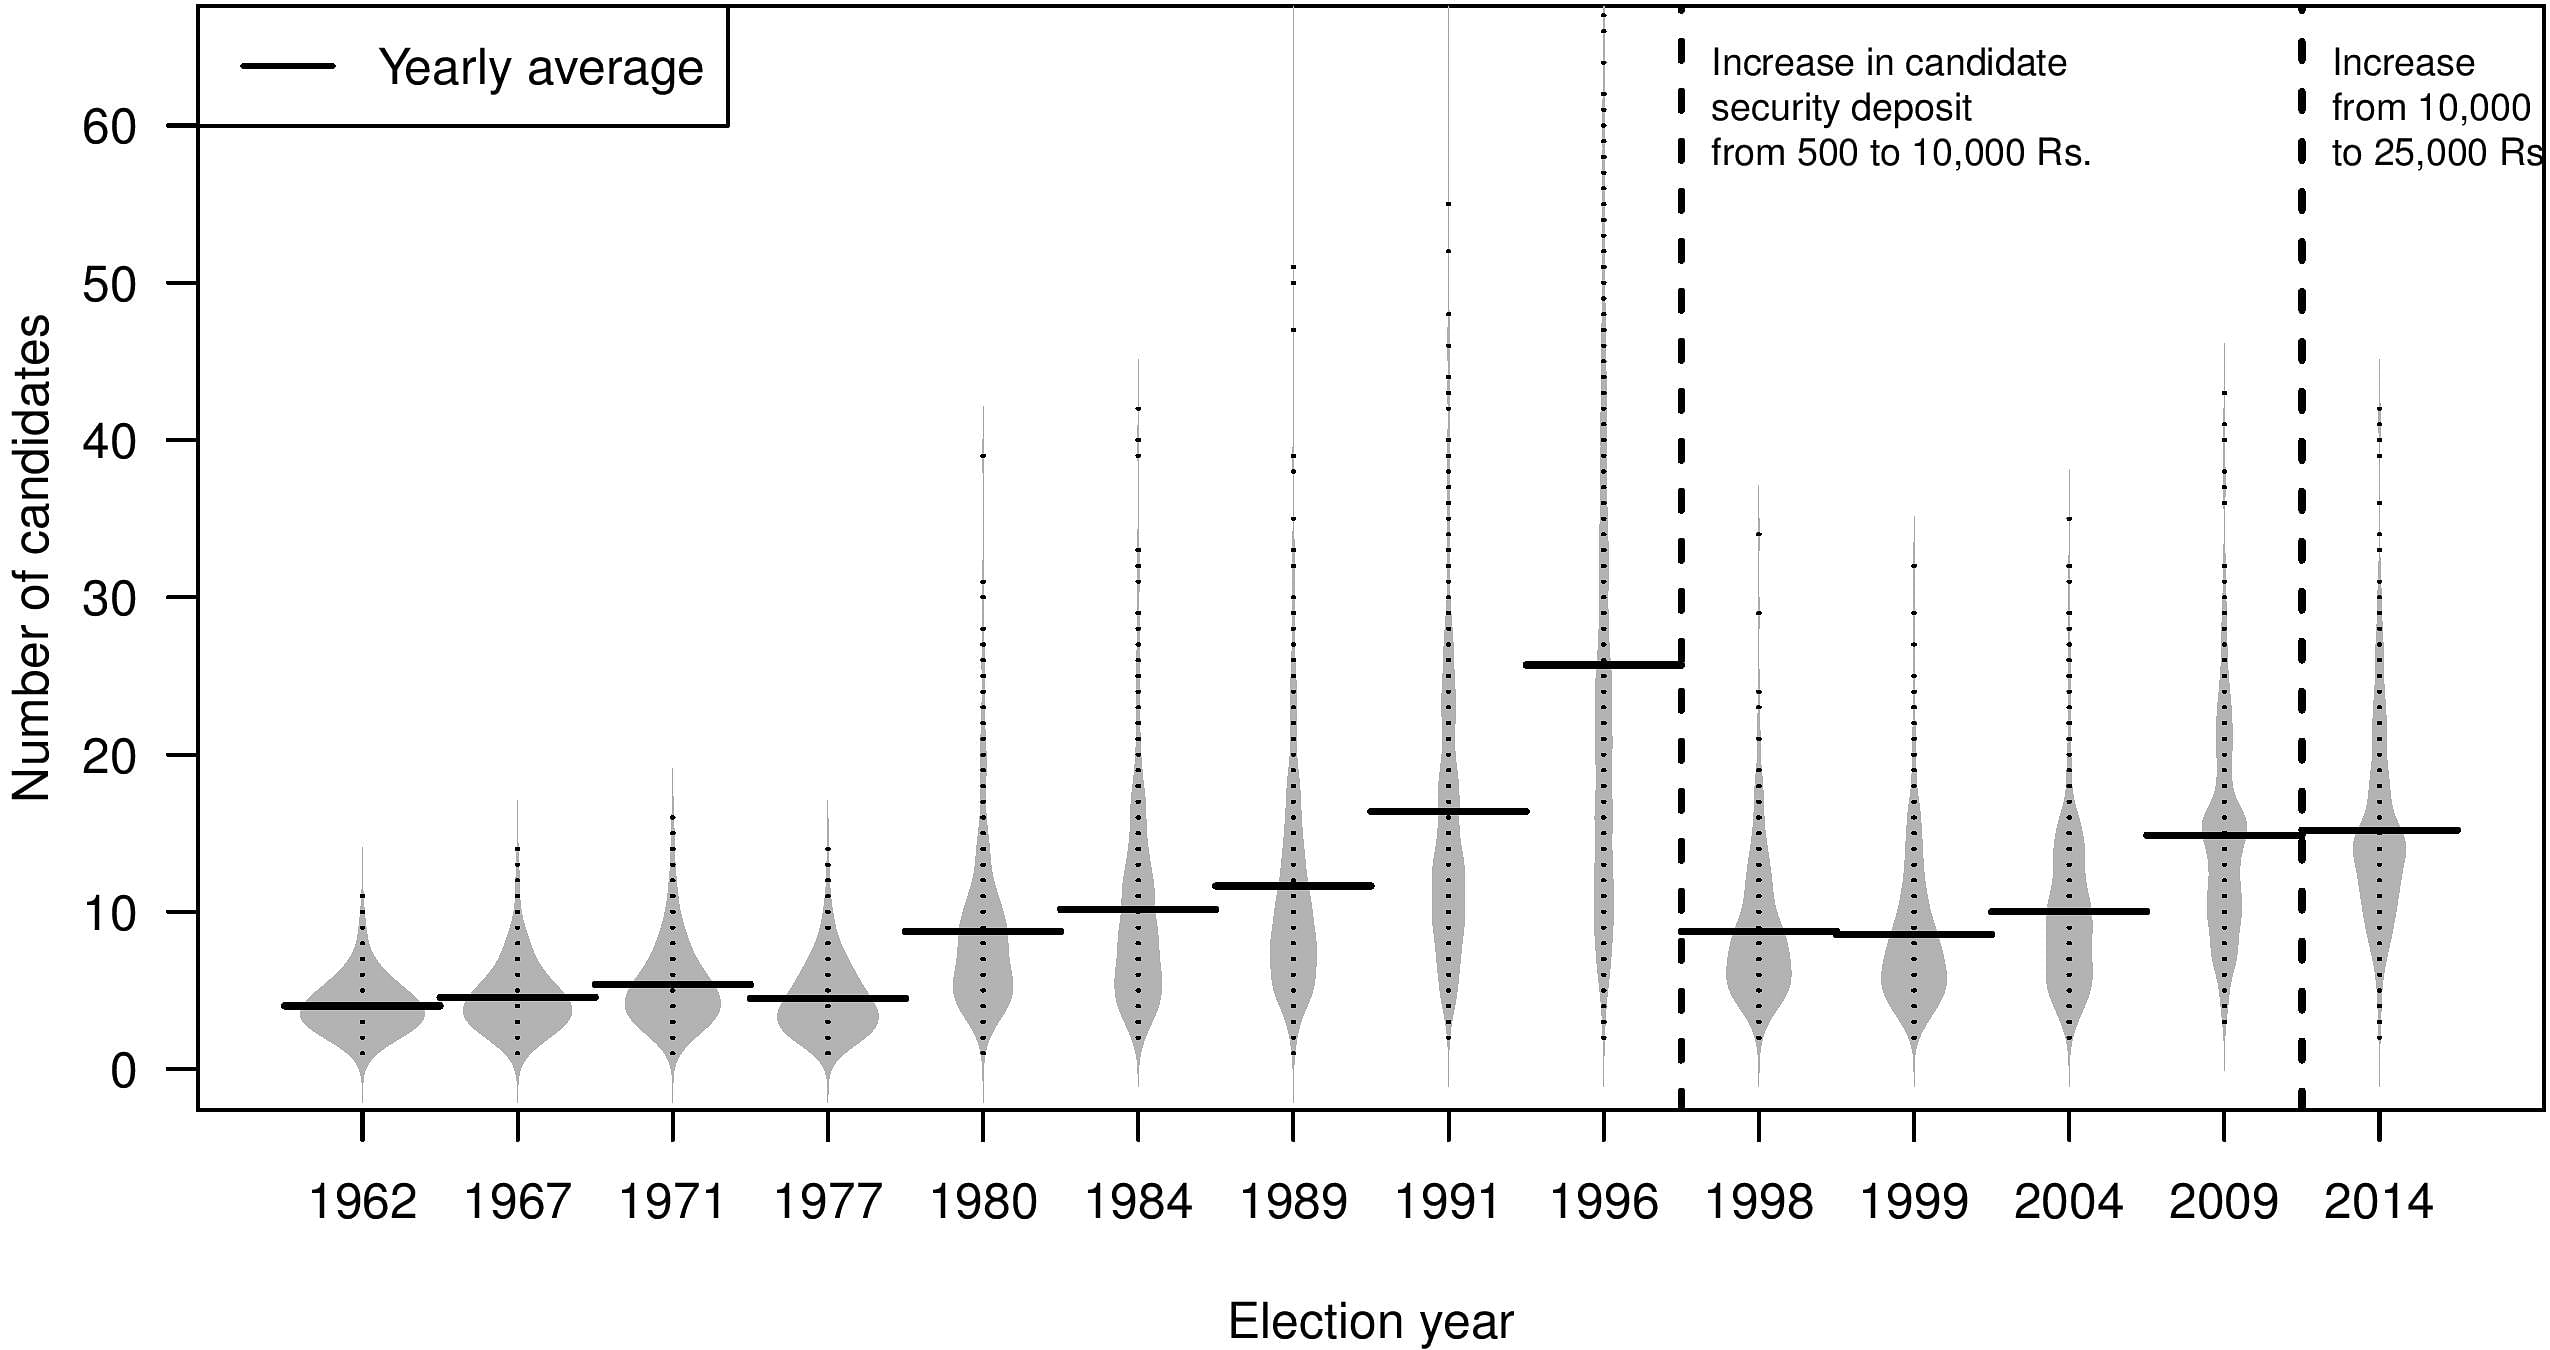
This number began to increase rapidly after the decline of the Congress party and the rise of coalition politics in the late 1960s and 1970s. In the 1980 elections, an average of about nine candidates contested from each parliamentary constituency, with as many as 39 candidates vying to enter the Lok Sabha from just one parliamentary constituency. The number of candidates running for a Lok Sabha seat kept growing until the 1996 election, when an average of almost 26 candidates competed for each Lok Sabha seat, and with up to 480 candidates contesting for a single Lok Sabha seat.
Higher security deposit
In response to the increasing number of candidates, the Election Commission of India (ECI) raised the deposit that candidates have to pay to the ECI to run in the election. The purpose of the deposit is to reduce the number of frivolous candidates. If a candidate gets more than one-sixth of the votes cast in that constituency, the deposit is returned. The amount originally set at Rs 500 under the Representation of the People Act, 1951 (the sum was half as much for SC and ST candidates) remained unchanged for 45 years. After the 1996 elections, which had a record number of candidates, the deposit was increased to Rs 10,000 for general candidates and Rs 5,000 for SC/ST candidates.
Also read: This data shows why Indian MPs don’t truly represent their people
The increase in the security deposit in 1996 had an immediate impact on the number of candidates running in elections. The average number of candidates competing in each Lok Sabha seat in the 1998 elections dropped to about 9 from approximately 26 in 1996.
In 2009, the deposit was further increased to Rs 25,000 for general candidates (and again, half that sum for SC/ST candidates). This substantial increase did not, however, have any effect on the number of candidates competing for each Lok Sabha seat, as an average of about 15 people contested in both 2009 and 2014 Lok Sabha elections. Those who were willing to pay Rs 10,000 to run for an election were clearly also willing to pay Rs 25,000.
Contesting unopposed
While in most constituencies, many candidates compete for the single seat, there are also those rare cases where a single candidate runs unopposed. This has occurred 13 times between 1962 and 2014.
Uncontested elections usually happen when there is a particularly strong candidate in the running. For example, Manabendra Shah, the last ruling monarch of the Garhwal Kingdom (a princely state that acceded to Independent India on 18 May 1948), was elected MP for the Congress party from Tehri Garhwal (in present-day Uttarakhand) in 1957. This was a constituency that overlapped with his old kingdom, and he won an overwhelming majority with 79 per cent of the total votes cast for him. In 1962, he ran for re-election unopposed.
Also read: Why voters don’t turn up in larger numbers in Lok Sabha elections – all politics is local
Another example is National Conference president Farooq Abdullah, the son of Sheikh Abdullah (then Chief Minister of Jammu & Kashmir and an icon in Kashmiri politics), who ran uncontested from Srinagar constituency in Jammu & Kashmir in 1980 when Sheikh Abdullah anointed him as his successor. The last time a Lok Sabha seat was won uncontested was in 1989, when Mohammad Shafi Bhat of the Jammu & Kashmir National Conference ran unopposed.
Rise of independents
The rise in the number of candidates contesting national elections over time has largely been driven by changes due to a rise in the number of independent candidates joining the electoral fray as shown in Figure 2. In 1962, about 24 per cent of the candidates were independents. This proportion rose to 37 per cent in 1967, 41 per cent in 1971, and peaked at 76 per cent in the 1996 elections. Following the increase in the deposit amount for candidates after 1996, the share of independent candidates dropped sharply and has since stabilised at about 40 per cent.
Figure 2: The number of independent candidates, their vote share, and electoral
success 1962-2014

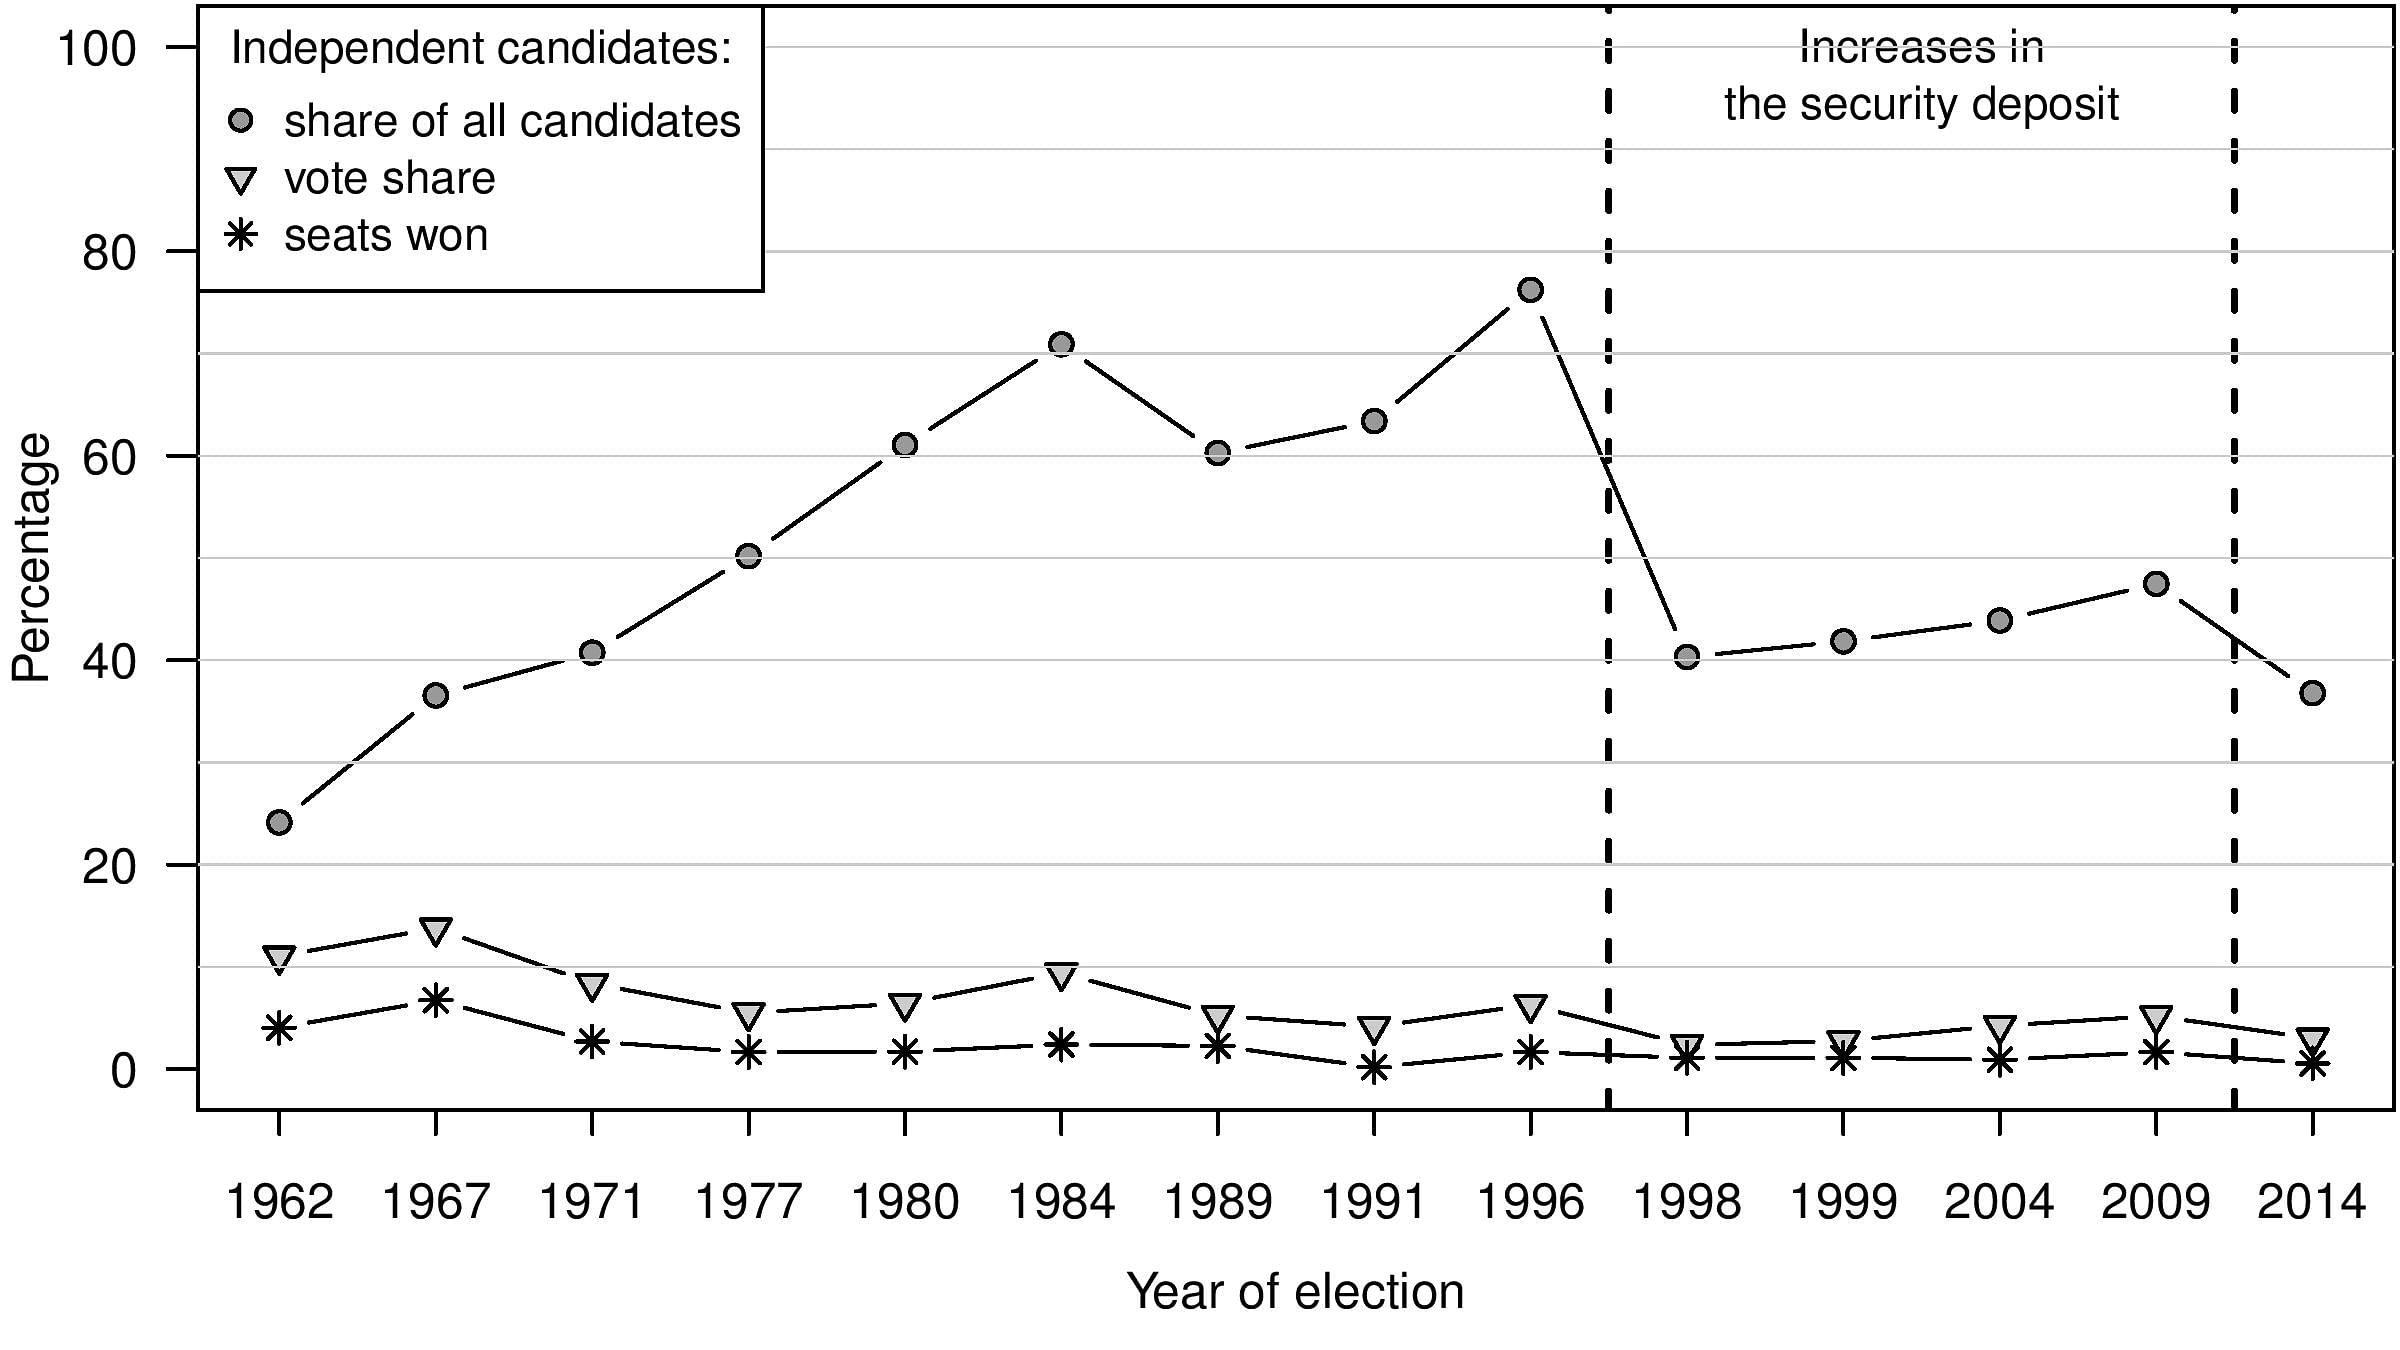
How do independent candidates fare in parliamentary elections? Even though a large number of candidates compete for seats in the Lok Sabha, they do not garner a substantial share of the votes, or win many seats. As Figure 2 shows, the vote share of independent candidates has dropped over time. In 1962, independents garnered about 11 per cent of the votes, and by 2014, this share had fallen to below 6 per cent, even though independents accounted for almost 40 per cent of all candidates.
Their share in the number of seats won was even lower: in the 1957 elections, independent candidates won nearly nine per cent of the seats in the Lok Sabha. By 2014, this number had dropped to less than three per cent. This also means that independent candidates play a marginal role in influencing the results in a constituency, where the average margin of victory in 2014 was approximately nine per cent.
Also read: 3 charts challenge lazy thinking on voter turnout and its link to literacy & urbanisation
Political parties rule
The poor performance of independent candidates indicates that electoral competition in India is primarily between political parties. An excellent example of the relevance of parties comes from the aforementioned Manabendra Shah, who, despite his name recognition, lost the elections in 1971 when he again contested as an independent. He returned to power in 1991, but on a BJP ticket.
Pradeep Chhibber is with the University of California, Berkeley. Francesca Jensenius teaches at the University of Oslo. Harsh Shah, an alumnus of the University of California, Berkeley, is a political analyst and works in the private sector.
This is the fourth in a series of articles in ThePrint that will provide readers with comprehensive, research-based information about the Indian elections since 1962. The articles will also draw upon recent findings from Constructing a Majority: A micro-level study of voting patterns in Indian elections (forthcoming Cambridge University Press) by Francesca Jensenius, Pradeep Chhibber, and Sanjeer Alam. Read the first article here, the second article here, and the third article here.