


India’s economic growth over the past three and a half decades has been striking but the headline numbers carry a persistent and increasingly urgent challenge of addressing the structural weaknesses in India’s labour force.
First, India’s labour force participation rate sits below the trend line for economies at comparable economic levels (Figure 1). This reflects a structural failure to productively engage a young population that is growing rapidly (NCAER Report, 2025).
Figure 1. Labour Force Participation Rates (LFPR) by GDP Per Capita (2024)
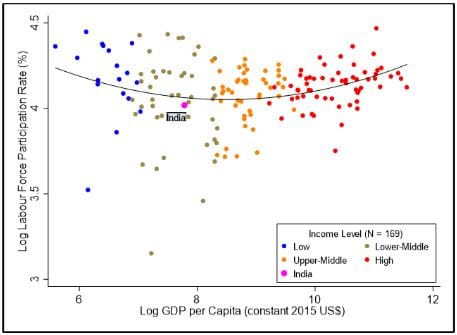
Notes: (i) The per capita GDP (gross domestic product) series is measured at constant 2015 US$ prices. (ii) LFPR is for ages 15+. (iii) Per capita GDP classifications follow the World Bank’s FY2025 income group thresholds. (iv) Sample consists of 169 countries.
Second, India’s workforce continues to exhibit disproportionate concentration in agriculture and self-employment, and limited expansion in salaried work (Periodic Labour Force Survey (PLFS) Annual Report, 2025). As seen in Figure 2, India’s agriculture sector continues to house the lion’s share of employment (about 45%), despite contributing less than 20% to total GVA (gross value added). The expected transition of surplus agricultural labour into formal wage employment remains incomplete. Labour market adjustment is taking place through informalisation, with workers entering the labour force in low-productivity and precarious forms of employment.
Figure 2. Sectoral shares in total GVA (gross value added) and employment in India
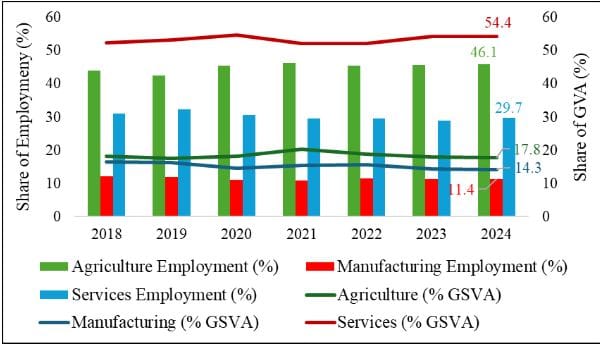
Note: GVA is in 2011-12 constant prices.
India’s employment and labour productivity challenge within a global perspective
Not surprisingly, India’s share of wage and salaried workers lies below the international average (Figure 3). This structural imbalance gets reflected in India’s anomalously higher share of self-employment relative to its per capita income (PLFS). This formalisation deficit remains the central labour market challenge as a large and increasingly educated workforce is unable to access stable contract-based work at scale.
Also read: History of Indians in the Arab world—port builders, Jat governor, translators, and slaves
Figure 3. Proportion of wage and salaried workers by GDP per capita (2024)
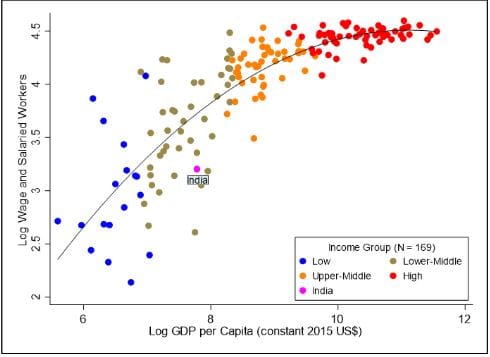
Notes: (i) Proportion of wage and salaried workers is given as percentage of total employment. (ii) Income classifications follow the World Bank’s FY25 thresholds. (iii) Sample consists of 169 countries.
Third, the informal structure of the workforce is accompanied by a consistent decline in India’s labour-capital ratio as income (Figure 4). The Penn World Table data (v11.0, 2023) tells us that India’s capital stock expanded by over seven times between 1990 and 2023, while employment roughly doubled in size. Capital is substituting for labour at a dramatic pace, even in sectors where India’s comparative advantage should favour the opposite.
Figure 4. Labour intensity of production by GDP per capita (1990-2023)
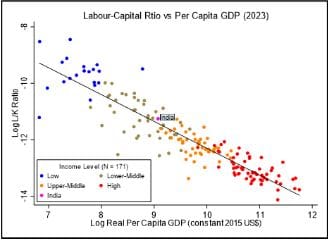
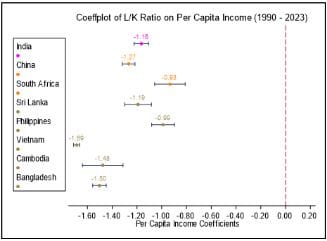
Notes: (i) L/K (labour/capital) ratio is the number of persons engaged (in millions) divided by capital stock measured at constant 2021 US$ prices (in millions), (ii) The per capita GDP series is measured at constant 2015 US$ prices. (iii) The colour scheme distinguishes the World Bank Income Groups (FY2025 thresholds) with the countries arranged in decreasing order of per capita GDP after India (right-hand side graph). (iv) Sample (left-hand side graph) consists of 171 countries. (v) 95% confidence interval bands are shown. A 95% confidence interval means that, if you were to repeat the experiment with new samples, 95% of the time the calculated confidence interval would contain the true effect.
The predominant informal structure accompanies low worker productivity. India’s output per worker is slightly above global labour productivity levels but still has a significant bridge to cross to reach the per capita GDP of high-income countries, even by 2047 (Figure 5). Cross-country regressions further indicate India’s weak relationship between productivity growth and income expansion, reflecting a dual nature of narrow concentration in capital and skill-intensive sectors, and a larger share of the workforce engaged in low-productivity activities (Figure 5).
Figure 5. Labour productivity by GDP per capita (1990-2018)
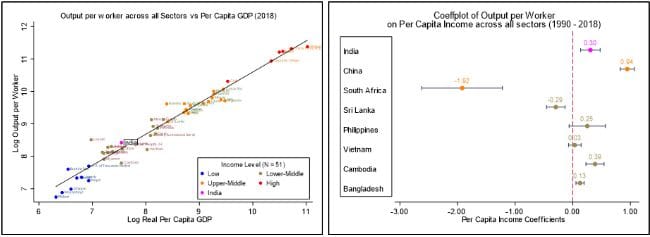
Notes: (i) Output per worker is GVA (measured in constant 2015 US$) divided by persons employed. (ii) Per capita GDP is in constant 2015 US$. (iii) Income classifications follow the World Bank’s 2017-18 thresholds. (iv) The colour scheme distinguishes the World Bank Income Groups with the countries arranged in decreasing order of per capita GDP (2018) after India. (v) Coefficients (right-hand side graph) are plotted with 95% confidence interval bands. (vi) Sample (left-hand side graph) consists of 51 non-OECD (Organisation for Economic Co-operation and Development) countries, as available in the ETD.
In summary, India faces a persistent challenge in generating formal, productive jobs for its growing workforce, with only a small share employed in the formal wage sector. The four new Labour Codes rolled out in November 2025, seek to address the structural imbalance in our workforce by simplifying 29 existing laws into a more coherent framework. This marks a shift from a fragmented legal system to a unified structure aimed at reducing regulatory complexity and improving compliance.
Farzana Afridi is Professor, Economics and Planning Unit, Indian Statistical Institute. She has a PhD in Economics from the University of Michigan, US. She is also a visiting professor at NCAER. Views are personal.
Over the next five weeks, based on their new NCAER working paper, Farzana Afridi and
other authors will review the new labour law reforms.
This article was originally published on the Ideas for India website.