Over the last few weeks, there has been a debate on whether the standard household surveys in India are representative of the reality in the country. While the issue is about the sampling strategy used by these surveys, the debates raise other important questions about the quality and availability of data and the process of drawing conclusions from it. These should be the subject of scrutiny.
The problem with the statistical system
The Census data is the sampling frame for most household surveys. One of the arguments being made today is that the projections from the 2011 Census underestimate the urban population of India. But the issue isn’t whether a particular survey under or overestimates a certain population. The question is: Why, even in 2023, do we have to rely on projections from the 2011 Census? The simple answer is that India has postponed the 2021 Census. We do not exactly know why it has been postponed and till when.
There have been other concerns about the official statistics system of India — from problems in the calculation of Gross Domestic Product (GDP) and Index of Industrial Production (IIP) to delaying the release of National Crime Records Bureau (NCRB) data to altogether withholding the 2017-2018 Consumer Expenditure Survey results. These do not bode well for the credibility of India’s statistical system.
Also read: Archaic data, pending reforms — what ails India’s statistical bodies, according to US research…
The importance of household surveys
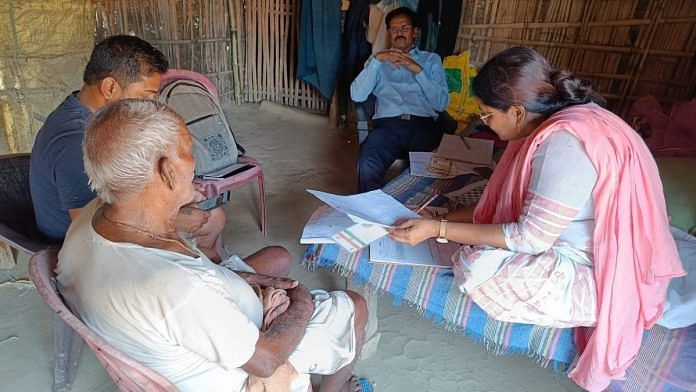
There are several indicators of the health of an economy. We hear about GDP, exports, or India’s trade deficit that are based on ‘macro’ data. But if we want to know how households in India are faring, then we need to find ways of measuring outcomes at the household level. It is neither possible nor advisable to go ask every household in the country what they consume, whether they work, what assets they own, how their health is, or how optimistic they feel about their economic and social circumstances. Hence, countries across the world rely on surveying a sample of households.
For a meaningful analysis, the sample of households has to be representative of the population. The survey strategy depends on what it is that one wants to measure. For example, if a survey is about how many complaints consumers have against their banks in a particular state, then the sampling will have to be done based on the prevalence of banking products in various districts of the state, and among various groups such as gender, age, occupation, etc. How many households one surveys is less important than whether the households adequately represent the groups for which analysis has to be conducted.
A sampling frame is required before conducting a survey — one that tells us the total number of households with specific characteristics in a region from which a sample can be drawn to ask more specific questions. Each household surveyed represents a certain section of the population. The aggregate estimate is a sum of all survey estimates weighted by how many other such households one estimate captures. The final estimate should always be seen as an average with a potential range and never as absolute.
Collecting household data is extremely challenging, given the difficulty of observing the field staff. This requires tremendous management capacity to train staff, monitor implementation on the field, and cross-check the results with a second round of a subset of the sample, preferably by a different team. Some of these processes may need to be upgraded in the existing government survey machinery.
Also read: Don’t drop disability questions from NFHS-6. It will create an information gap
Reading the survey results
The very nature of sampling precludes the possibility of obtaining an absolute point estimate. This has lessons for policy conclusions that we draw from survey data. For example, the manner in which a question is asked matters disproportionately against what one can learn from the answer. You may ask someone if the “person is working on the day?” vs if the “person has a job on the day”. The answer to the first can be yes, and the second can be a no, depending on how the respondent interprets the meaning of the word “job”.
Research shows that women often respond to employment questions in the negative. But if one were to probe further, one might find that they are helping with the family enterprise which can constitute as “work outside the usual housework”. Results from two surveys that either use different samples or ask different questions to similar samples can thus be different. This is not to say that survey results are meaningless but to emphasise that one must be careful about exactly what a specific survey is measuring.
It is always a good idea to see if survey results are consistent with other indicators of the economy. The problems of measurement make it difficult to do this in India. These larger problems that India’s statistical system faces should be the subject of more scrutiny.
Renuka Sane is research director at TrustBridge, which works on improving the rule of law for better economic outcomes for India. Views are personal. She tweets @resanering.
(Edited by Humra Laeeq)


