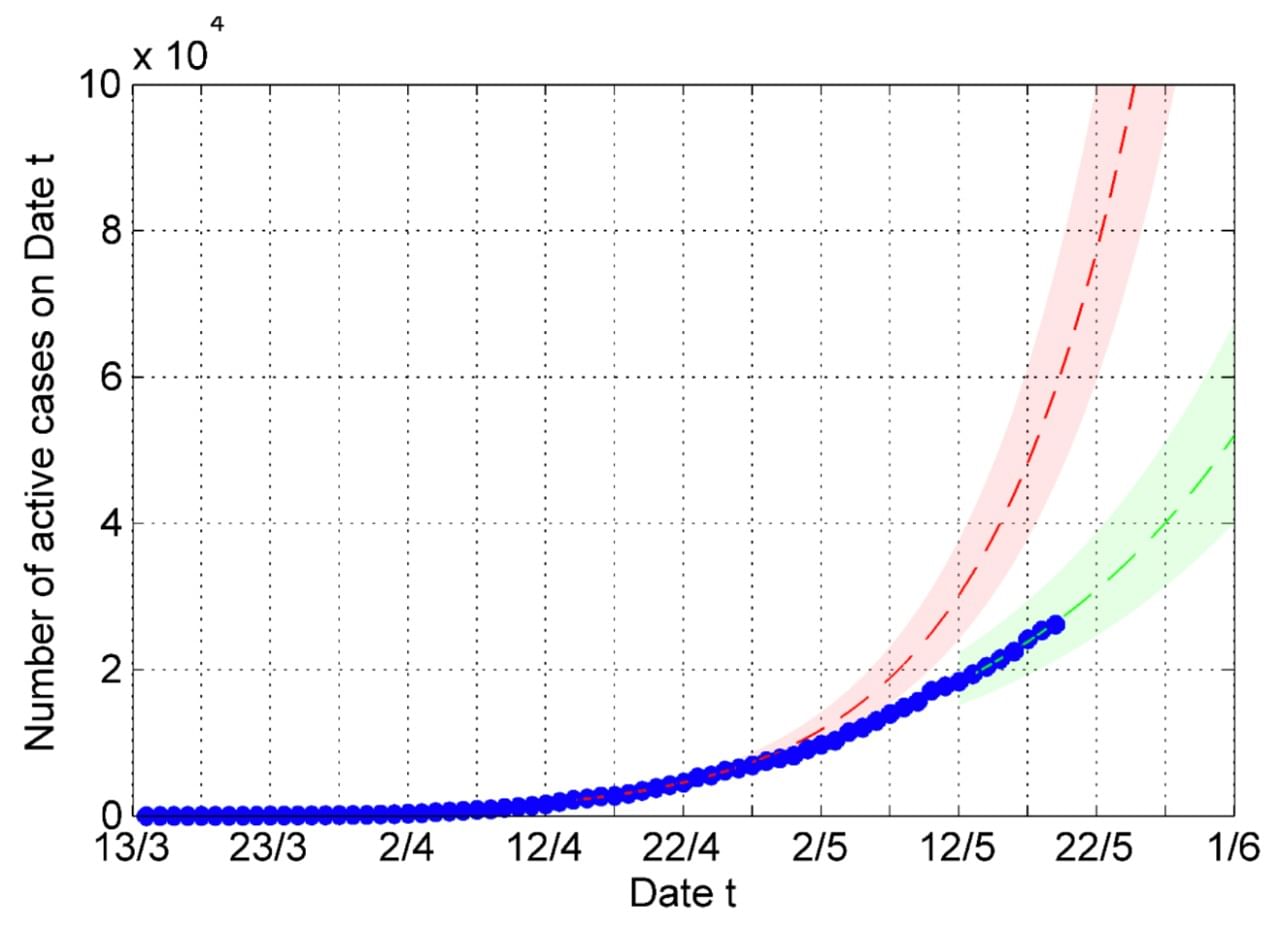
New Delhi: States with the highest number of active coronavirus cases in India, such as Maharashtra, Uttar Pradesh, and Tamil Nadu are showing a decline in the rate of growth of new infections, according to the latest analysis by researchers at the Chennai-based Institute of Mathematical Sciences (IMSc).
States like Bihar, Odisha and Karnataka, meanwhile, have very recently seen spurts in the growth rate, according to Sitabhra Sinha, a researcher at IMSc who has been tracking the progress of Covid-19 in India.
While scientists initially studied Covid-19 growth patterns through the metric ‘R0’, they are now analysing them through ‘R’. R and R0 both denote the number of people one patient can infect, but they serve different purposes. R0 is calculated at the beginning of the epidemic, when the entire population is assumed to be susceptible to the disease.
R, which changes with time, takes into account the fact that some individuals are protected from the disease, either because they have developed immunity or because of social distancing and other measures, Sinha told ThePrint.
For India, the value of R has reduced to 1.22 this week. At the beginning of the epidemic, between 4 March and 6 April, R0 or the basic reproduction number for India was 1.83.
Also Read: Can India risk a controlled epidemic after lockdown ends? It will depend on these factors
‘R value approaching 1’
With 41,642 confirmed cases of Covid-19 by Friday (11,726 cured/discharged/migrated and 1,454 deaths), Maharashtra is the worst-affected state in India.

However, the state’s growth curve resembles the exponential growth curve of the country as a whole — its slope has been steadily decreasing over the last five weeks.
Exponential growth is when a quantity increases with a rate proportional to the current size. This means that as the number of infected cases increases, so does the number of new cases.
The R for Maharashtra from 13-26 April was 1.49, falling to 1.34 between 23 April and 15 May.
This came down further to 1.27 between 12 May and 19 May, Sinha said, adding that most states with a large number of cases are beginning to show a reduction in growth rates.
“For example, for Uttar Pradesh and Andhra Pradesh, R is approaching 1. This does not mean that the active cases have become constant, it just means that the growth is not exponential,” Sinha said.
The value of R for Gujarat, Madhya Pradesh and Rajasthan falls between 1.1 and 1.2. R must be driven below 1 to completely arrest the epidemic.
Between April and May, Tamil Nadu saw a spike in Covid-19 cases linked to Chennai’s Koyambedu wholesale market, which has reportedly been kept open through the lockdown.
Between 29 April and 4 May, the state’s R was at 1.83, further rising to 2.01 between 30 April and 7 May. However, the state is now showing sub-exponential growth.
“Once growth rates become very slow, it is not possible to use my method to give a robust estimate of R,” he said, adding that Delhi also has sub-exponential growth.
While the low reproduction numbers are encouraging, the epidemic may begin to grow again once stringent restrictions on the movement of people are removed since the value of R remains higher than 1.
Also Read: India ranks low on Covid testing but has done well on number of infections and deaths
Different trends
There’s a different trend afoot in Bihar, Odisha and Karnataka, which have recently seen spurts in the growth rate. The R is higher than 1.5 in these states, Sinha said.
In some states, he added, there were deep fluctuations in trends. For example, between 20 April and 23 April, Bihar had an R value of 2.01. After an inexplicable dip the following week (almost approaching 1), the R in Bihar is now over 1.5.
“Initially, I had called out Bihar as the place to watch out for. But immediately after that the growth numbers started going down and then again started rising,” Sinha said.
“This could be either because some portions of the cases went unreported, or it could be that with the incoming migrants, the numbers started to flare up.”
The state is looking to bring back over two lakh migrant workers through the special Shramik Express trains started this month, but its current testing capacity is under 2,000/day. Similarly, in West Bengal, the R was estimated at 1.51 between 15 April and 28 April. It declined to 1.14 between 28 April and 1 May, and again rose to 1.34 between 4 May and 10 May.
Both Bihar and West Bengal are among the states with the lowest testing rates. With relaxation in lockdown restrictions and interstate travel slowly resuming, the R value for states is likely to rise again, but any changes will only reflect about 10 to 14 days later.
Also Read: Ignore hype and euphoria over any Covid vaccine news for next 2-3 months: Adar Poonawalla


