





Officials have repeatedly pointed to EPFO’s enrolment numbers as evidence that India is creating jobs on a large scale. As per the data, EPFO added 6.2 crore subscribers between September 2017 and March 2024. But labour economists Santosh Mehrotra and Kingshuk Sarkar explained why the number should not be read as 6.2 crore new jobs. Their argument is that some of those enrolments reflect reorganisation within EPFO’s own data architecture, rather than new positions. Another chunk is formalisation: workers who were already employed somewhere are being brought under EPF coverage for the first time.
A 2020 Supreme Court ruling extended PF entitlement to contract workers, so already-employed contract staff who were reclassified under that ruling also show up as fresh enrollments. And over the 2017-2024 period, actual employment growth was concentrated in agriculture, which is usually interpreted as a sign of underemployment rather than an expansion of good jobs.
This mechanism is not hypothetical, either. The Employees’ Enrolment Scheme 2025, an amnesty programme, allowed employers to retroactively register workers who joined between July 2017 and October 2025 for a flat Rs 100 penalty. Every worker who got declared through that window between November 2025 and April 2026 will show up in EPFO’s enrollment count. None of them will be a new job.
Which unemployment rate do you mean?
Once you accept that EPFO enrollment is not a job-creation number, the next question is what actually measures joblessness in India. The honest answer is that it depends which of the three legitimate figures you pick.
The Periodic Labour Force Survey (PLFS)’s annual “usual status” measure, which uses a 365-day recall period and counts anyone who did any work at all as employed, put unemployment at 3.2 per cent for 2023-24.
From January 2025, PLFS was redesigned into a monthly rotational panel that also produces a stricter, seven-day-recall measure called Current Weekly Status. Through the first seven months of 2026, that monthly figure has run between 4.9 and 5.5 per cent, roughly 1.6 times the annual number, simply because a shorter recall window catches more of the in-between periods when someone is out of work.
CMIE, often cited as the harder-nosed alternative to official data, told a different story through most of 2025, peaking near 7.6 per cent in October, but by mid-2026, its monthly rate had eased to the same 5.0 to 5.5 per cent range that PLFS’s own new monthly figure now shows.
The gap between “official” and “independent” unemployment data, which drove much of the argument over the last two years, has largely closed. What is left is a more mundane but still real fact: by the measure closest to how other countries define unemployment, India’s rate is closer to 5 per cent than to 3 per cent.
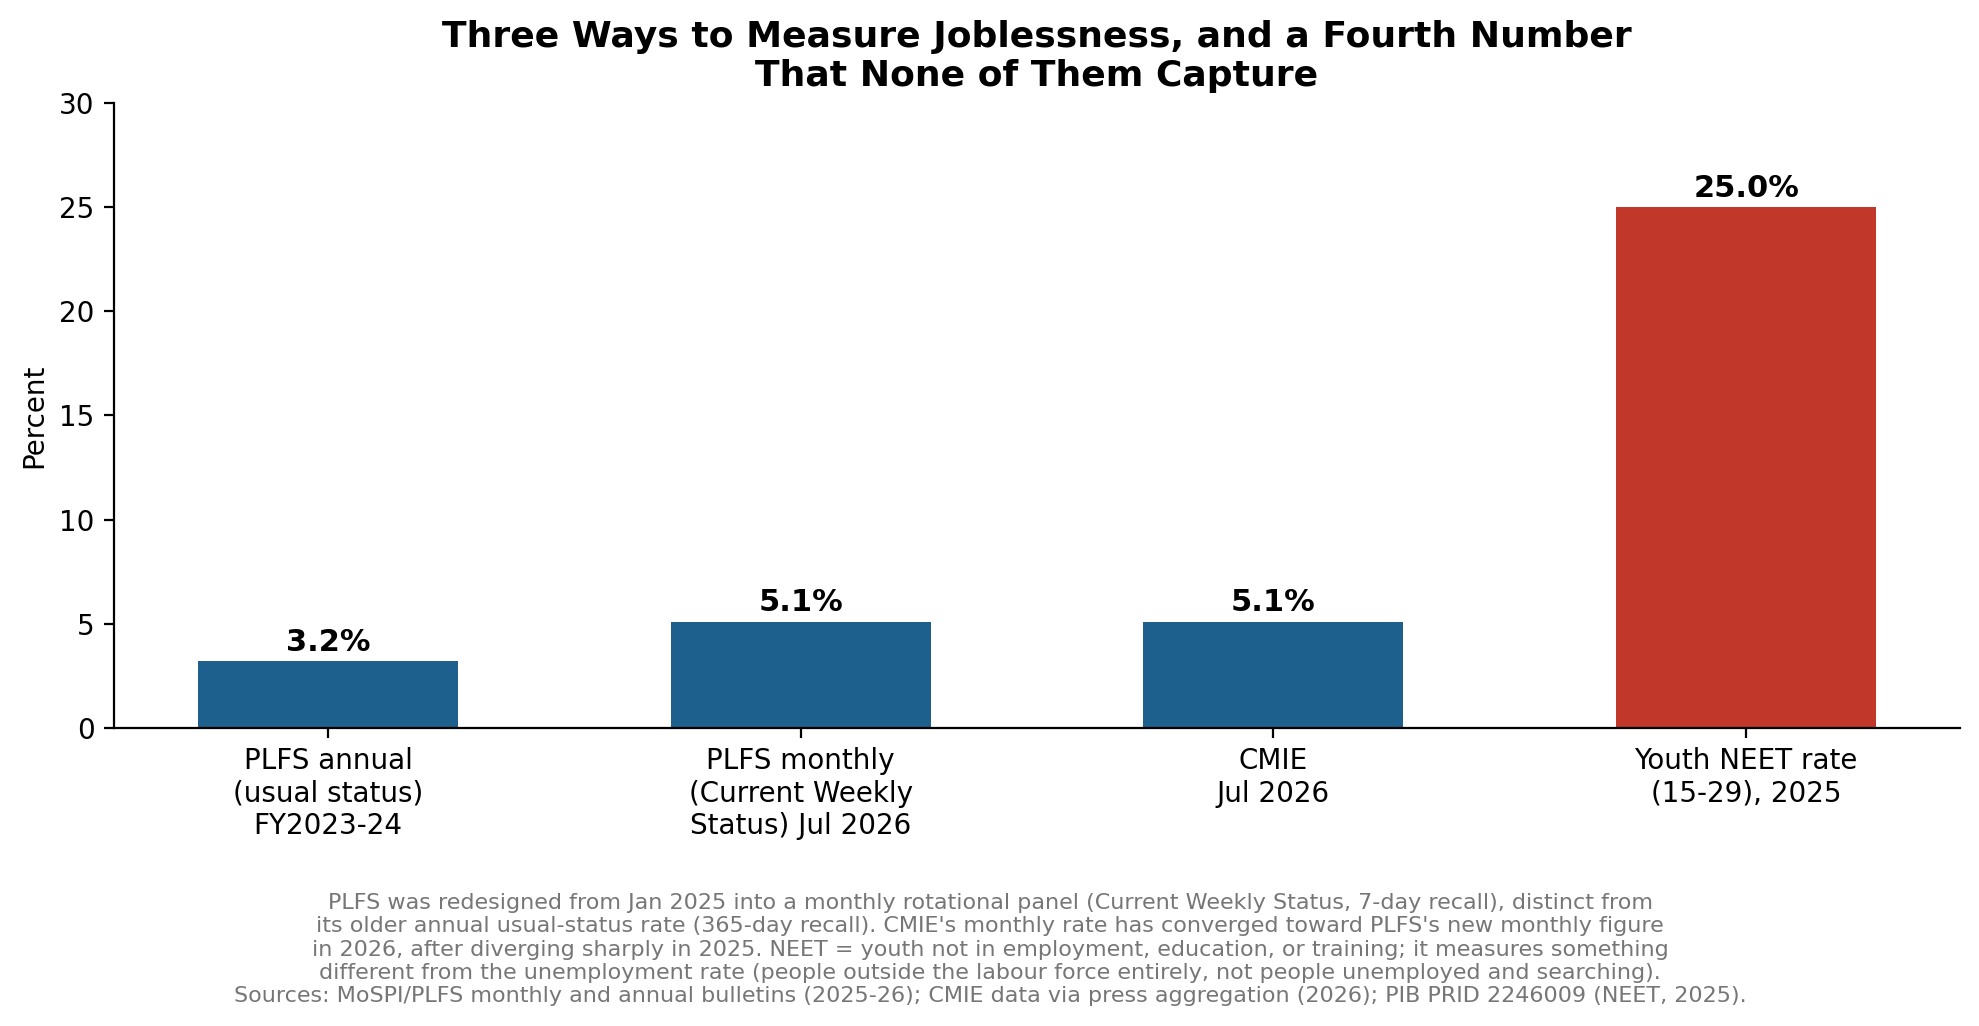
None of these three numbers, though, capture the statistic that is arguably the most damning one available: last year, 25 per cent of Indians aged 15 to 29 were neither employed, nor in education or training — the NEET category. Unlike unemployment rate, which counts people who are without work and looking for it, the NEET measure also captures those who have left the labour force and the education system entirely. Effectively, a quarter of India’s youth sit outside every category that “unemployment rate” is built to measure.
Also read: Is EPFO data right metric to show job creation? No, say experts citing its data limitations
Finding a job is not the same as finding a good one
Even people who are working are not obviously doing well. In the PLFS’ 2023-24 round, 73 per cent of non-agricultural workers were classified as informal, which means no written contract, no paid leave, no social security. Close to 58 per cent of all workers were self-employed, more than a fifth earned regular wages or salaries, and the remainder worked as casual labour.
Female labour force participation has risen sharply, from 23.3 per cent in 2017-18 to 41.7 per cent in 2023-24. This is a large shift and is often cited as good news.
But PLFS data on the composition of that increase complicates the picture. The share of unpaid family workers has risen while the shares of casual and salaried workers have fallen. Several economists read this as a sign that some households are pushing more members into low-productivity work out of necessity rather than because better opportunities have opened up. That interpretation remains contested; the underlying shift in the composition of women’s employment is not and is well documented.
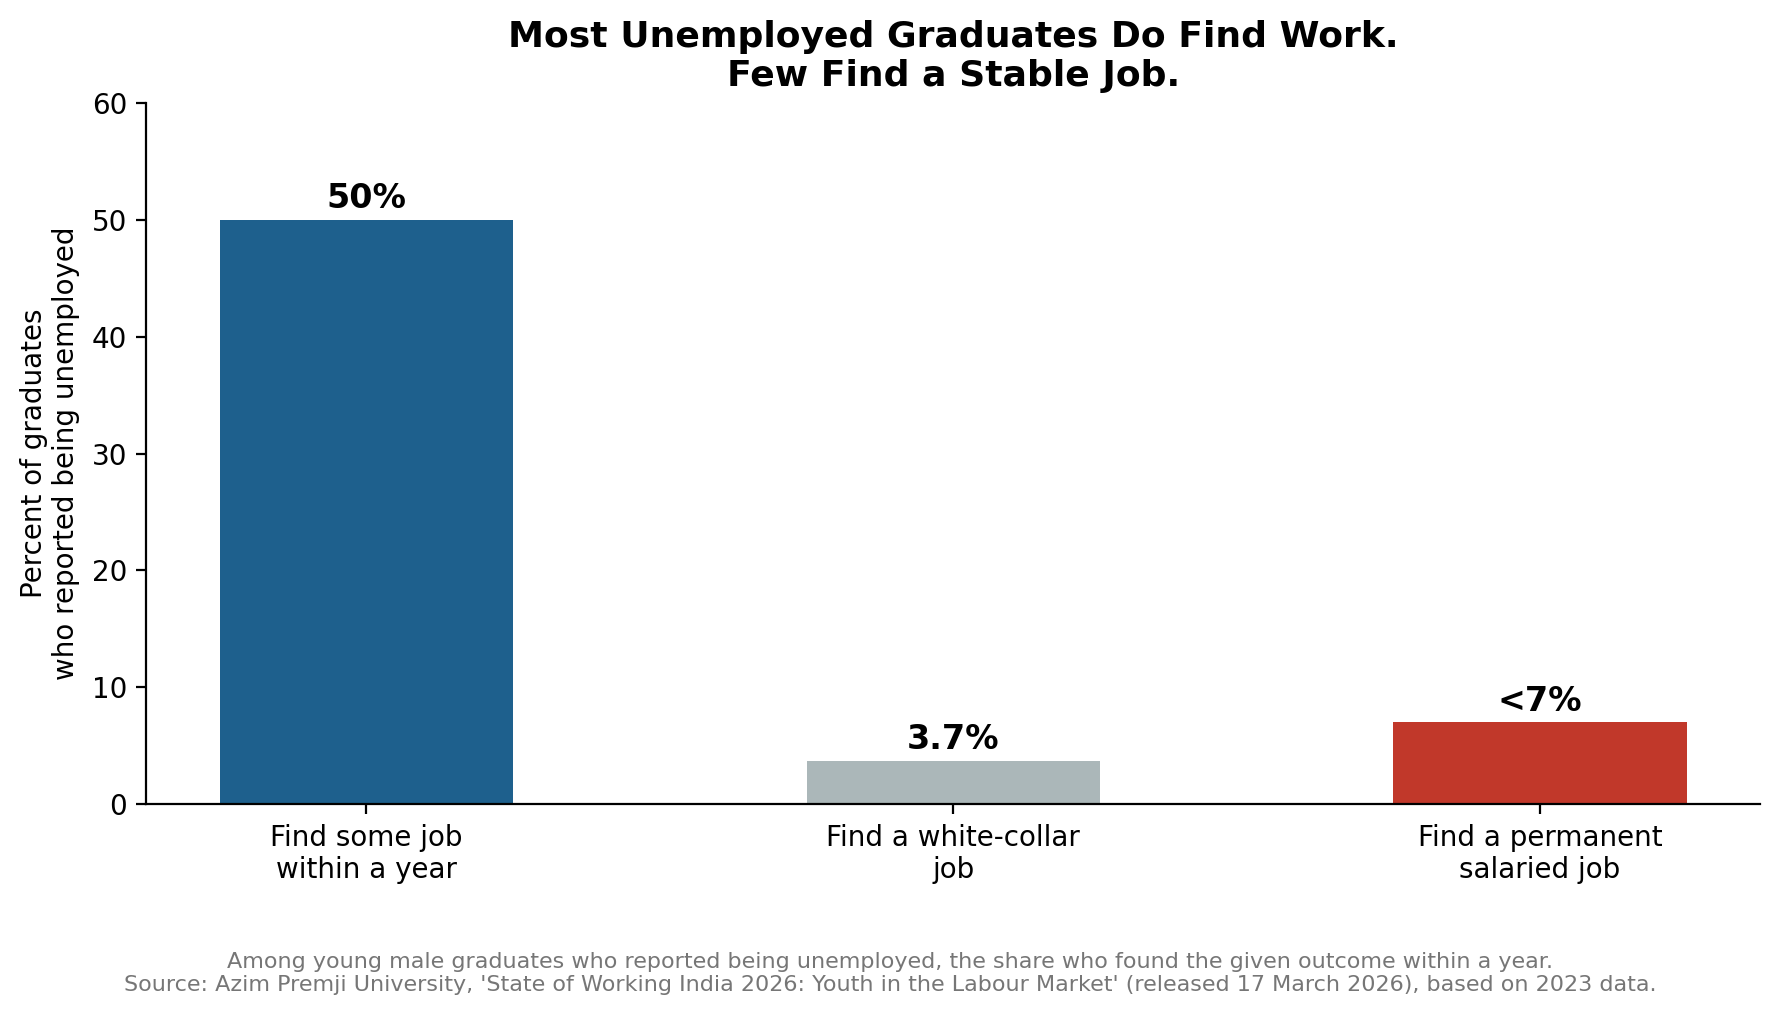
Azim Premji University’s State of Working India 2026 report puts a sharper point on the same idea. Among young male graduates who reported being unemployed, half found some job within a year. Far fewer found the kind of job they were presumably chasing: only 3.7 per cent landed a white-collar position, and fewer than 7 per cent landed a permanent, salaried job of any kind. The gap between those two numbers — half find something, one in fourteen finds something stable — is a more precise description of India’s jobs problem than any single unemployment rate.
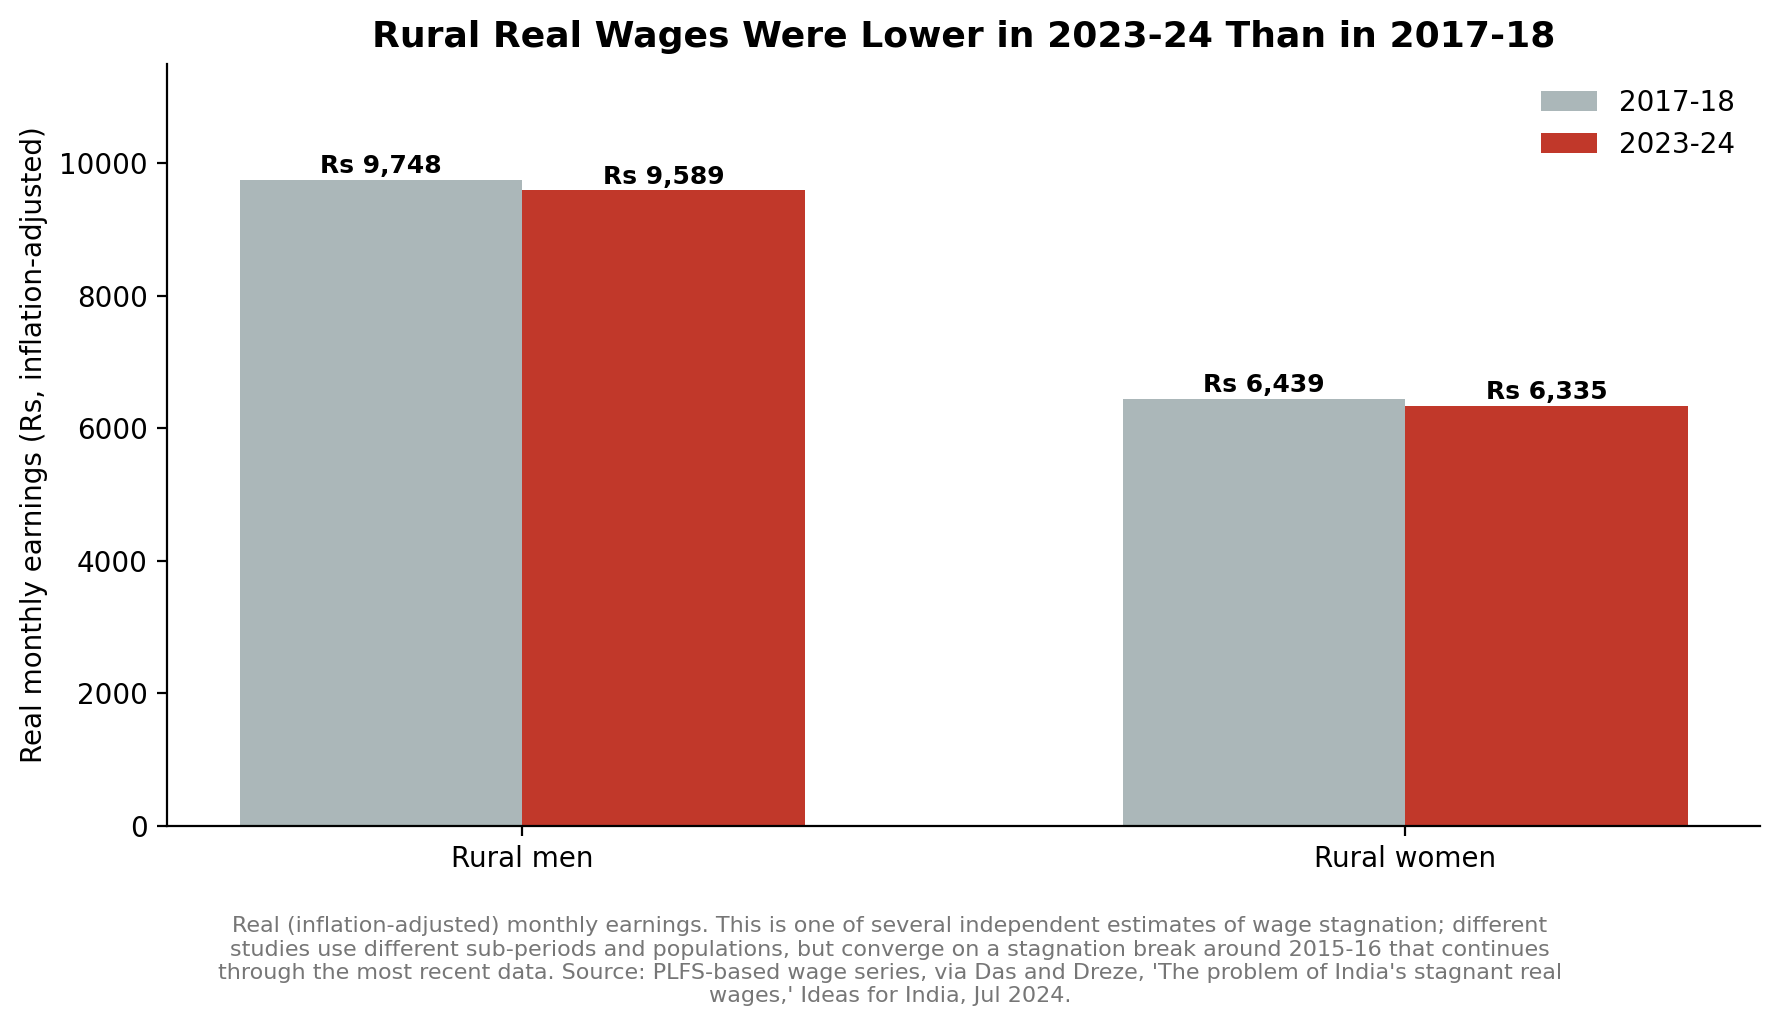
Wages tell a similar story. Real, inflation-adjusted monthly earnings for rural workers were lower in 2023-24 than in 2017-18, for both men (Rs 9,748 down to Rs 9,589) and women (Rs 6,439 down to Rs 6,335). Multiple independent studies, using different sub-periods and populations, converge on the same underlying pattern: a stagnation break around 2015-16 that has not meaningfully reversed since.
People feel this, and it shows up when they vote
Lokniti-CSDS’s pre-poll survey ahead of the 2024 Lok Sabha election, based on interviews with more than 10,000 voters across 19 states, put a number on how widely this is actually felt: unemployment was named the single-most important issue by 27 per cent of respondents, ahead of price rise at 23 per cent. Sixty-two percent said finding a job had become harder, a view that ran even higher among Muslim (67 per cent), OBC (63 per cent), and Scheduled Tribe (59 per cent) respondents. A nationally representative survey built to measure exactly this found the same pattern.
An EPFO enrollment record measures formalisation, job switching and, now, compliance-window amnesty. It is not a clean count of new jobs.
The formal jobs record and the sense of a jobs crisis are not contradicting each other. They are describing two different, barely overlapping slices of the same economy.
Piyush Zaware is a graduate researcher in economics at the University of Chicago and a researcher at the Global Poverty Research Laboratory at Northwestern Kellogg School of Management. He tweets @pzaware19. Views are personal.
(Edited by Prashant Dixit)