


Urban India’s housing markets are full of contradictions. On the one hand, India’s real estate markets are some of the most expensive in the world (Chakravorty 2013, Nijman 2000). On the other hand, roughly 15-17% of India’s urban population lives in informal houses or slums. Census data also indicates that about 12% of urban India’s housing stock was vacant in 2011 (Census 2011, Gandhi et al. 2021). It is difficult to reconcile these facts without an understanding of the housing supply response to rising demand in Indian cities.
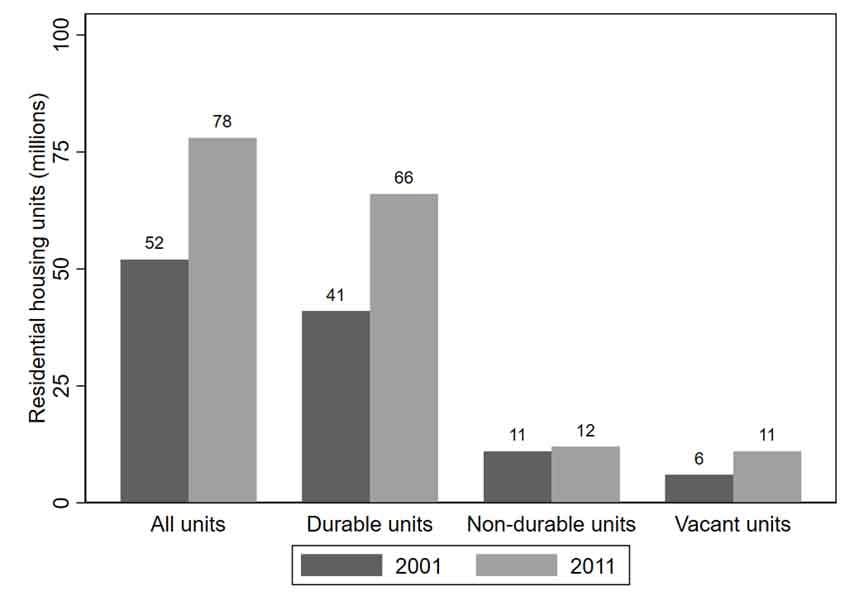
With about 377 million people, India has the second-largest urban population in the world, and its urban population is growing at a decadal rate of 32% (Census 2011). Has urban India’s housing supply kept pace with this rising demand? In Figure 1, we use Census data to show the growth in the housing stock in Indian cities between 2001 and 2011. While the formal (durable) housing stock grew by 61%, the informal (non-durable) housing stock grew at a modest pace of 9%. At the same time, the stock of urban India’s vacant houses also increased by about 80%. Do these figures mean that India’s housing shortage problem was resolved, and the urban markets started oversupplying during the 2000s?
Figure 1. Housing units by type of construction in urban India
In a recent study (Dutta et al. 2021), we use data from several sources (National Sample Survey Office (NSSO), 2008, Census 2001, 2011, Ghani et al 2016, India Meteorological Department, 2017) to estimate housing supply elasticities1 for: i) durable or formal houses made of concrete, bricks, and metal; ii) non-durable or informal houses made of thatch, mud, plastic, etc., and typically found in slums; and iii) vacant houses, during the 2000s.
Also read: Rental housing in India is so broken, tenants and landlords are even teaming up in Delhi
The supply elasticity estimation problem
Estimating supply elasticities is difficult because we never directly observe supply curves. We only observe over time the market clearing prices and quantities that reflect a combination of supply and demand dynamics. To resolve this problem, we require demand shifting events to trace out the supply curve. In other words, we need an instrumental variable that changes housing demand but not the unobserved features potentially affecting housing supply.
In a spatial equilibrium framework3, we propose that migration-inducing exogenous events, such as negative rainfall shocks and highway upgrade programmes, that occur in one location can affect the demand for housing in another, with migration being the channel of effect.
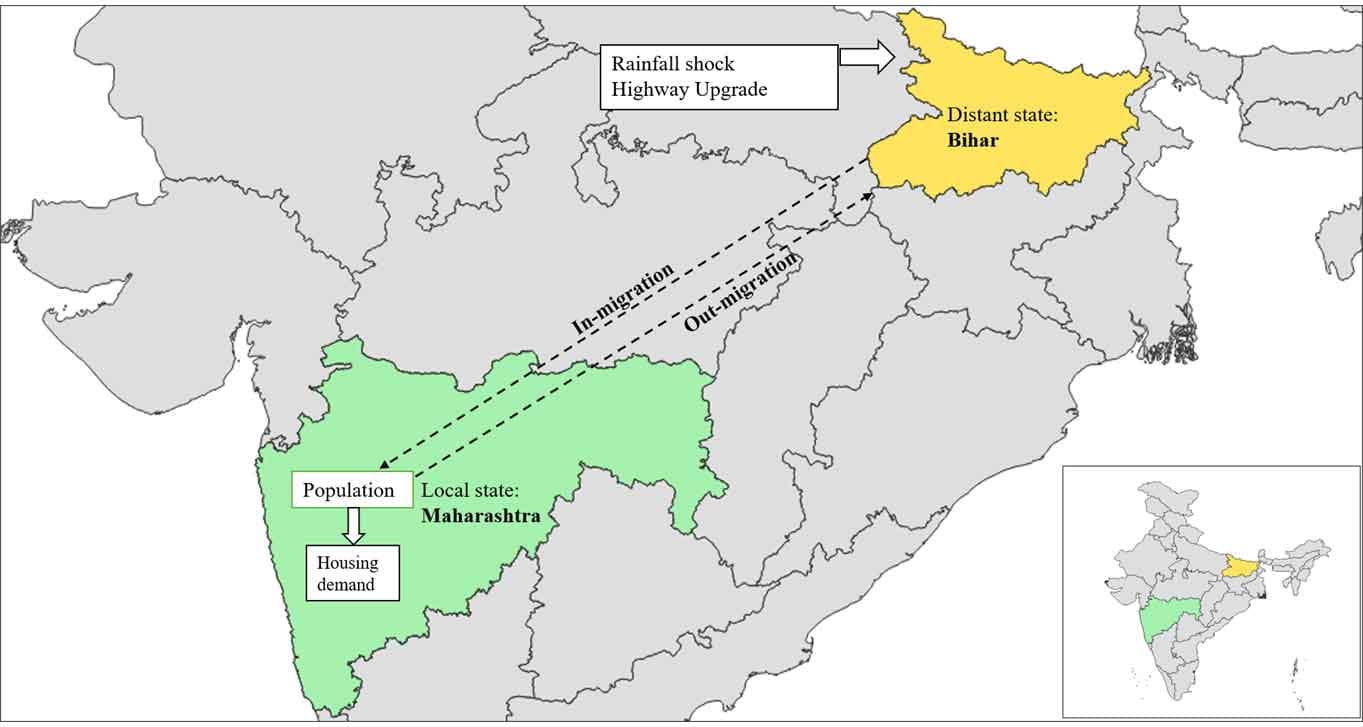
Consider two states: Maharashtra and Bihar, where we treat Maharashtra as a local state, and Bihar as a distant state. Suppose Bihar has below average rainfall — a drought. The drought will influence wages and rents in Bihar, while not having any effect on Maharashtra. This will create a spatial disequilibrium between the two states, leading people to migrate from Bihar to Maharashtra. Higher migration will change the population growth in Maharashtra, and hence, cause its demand curve to shift. This will trace out Maharashtra’s supply curve. A similar argument can be made for the consequences of highway upgrade investments. We provide a visual display of these mechanisms in Figure 2.
Figure 2. Impact of shock-induced migration on housing demand
Our empirical analysis indicates that negative rainfall shocks and a highway upgrade programme increased inter-state migration in India during 2001-2011. On the one hand, an additional month of limited rainfall, which we define as less than 80% of the long-term normal during a decade, increased decadal out-migration from affected regions by 1.1%. On the other hand, a distant state’s inclusion in the Golden Quadrilateral (GQ) highway upgrade programme increased migration to and from such states.4 This increased inter-state mobility led to urban population growth in the local state, which in turn increased the demand for housing in local urban housing markets. We show that negative rainfall shocks and the GQ highway upgrade programme are strong instruments for the number of durable, non-durable, and vacant houses in local urban markets.
Also read: 4 challenges Model Tenancy Act must overcome to provide affordable housing
Validity of instrumental variables
To provide valid estimates, the demand shifters we use (negative rainfall shocks and the GQ programme) need to affect housing demand without impacting housing supply. We summarise the validity of the instruments we employ, by addressing two potential problems with the instruments.
First, in the spatial equilibrium framework, shocks occurring in one state can affect the housing supply in neighbouring states (Bhavnani and Lacina 2017). For instance, if Bihar receives positive (or low negative) rainfall shocks which cause flooding, a portion of the housing stock in the neighbouring state of West Bengal may be destroyed because several of the major rivers carrying the excess water from Bihar to downstream areas, would cause floods in West Bengal too. We resolve this problem by conducting a robustness analysis, where we redefine the instruments to include only shocks that occur in non-neighbouring states. We find that our empirical estimates are similar.
A second problem arises if migrants moving in response to the exogenous events in distant states work in housing construction, thus affecting the housing supply in their destinations. This means migrants might affect both housing supply and demand at their destinations. However, the vast majority of inter-state migrants in India that work in the construction sector at their destinations move on a seasonal basis – that is, they migrate for a period of one to six months – before returning to their homes (NSSO, 2008). In our robustness analysis, we estimate that the distant-state shocks affect long-term migration as well, that is, individuals who move and stay at their destinations for at least a year. The housing supply would not be affected substantially by long-term migration because very few long-term migrants work in housing construction at their destinations (NSSO, 2008).
Also read: Reverse migration during COVID impacted real estate projects: Govt
Decadal supply elasticity estimates
Our findings are three-fold. First, we estimate that the decadal supply elasticity of formal housing in urban India was 1.62. Despite the differences in institutions and context, India’s formal housing supply elasticity is similar to the United States’ elasticity of 1.75 estimated by Saiz (2010). Second, we find that the supply elasticity of informal housing was -0.49. A negative supply elasticity value for informal houses is consistent with the existence of urban gentrification through the demolition and upgradation of slums in India (Rains and Krishna 2020). Finally, we estimate the elasticity of vacant formal residential housing units’ supply to be 2.62. We posit that a relatively higher vacant housing supply elasticity reflects speculative construction by developers in Indian cities during the 2000s.
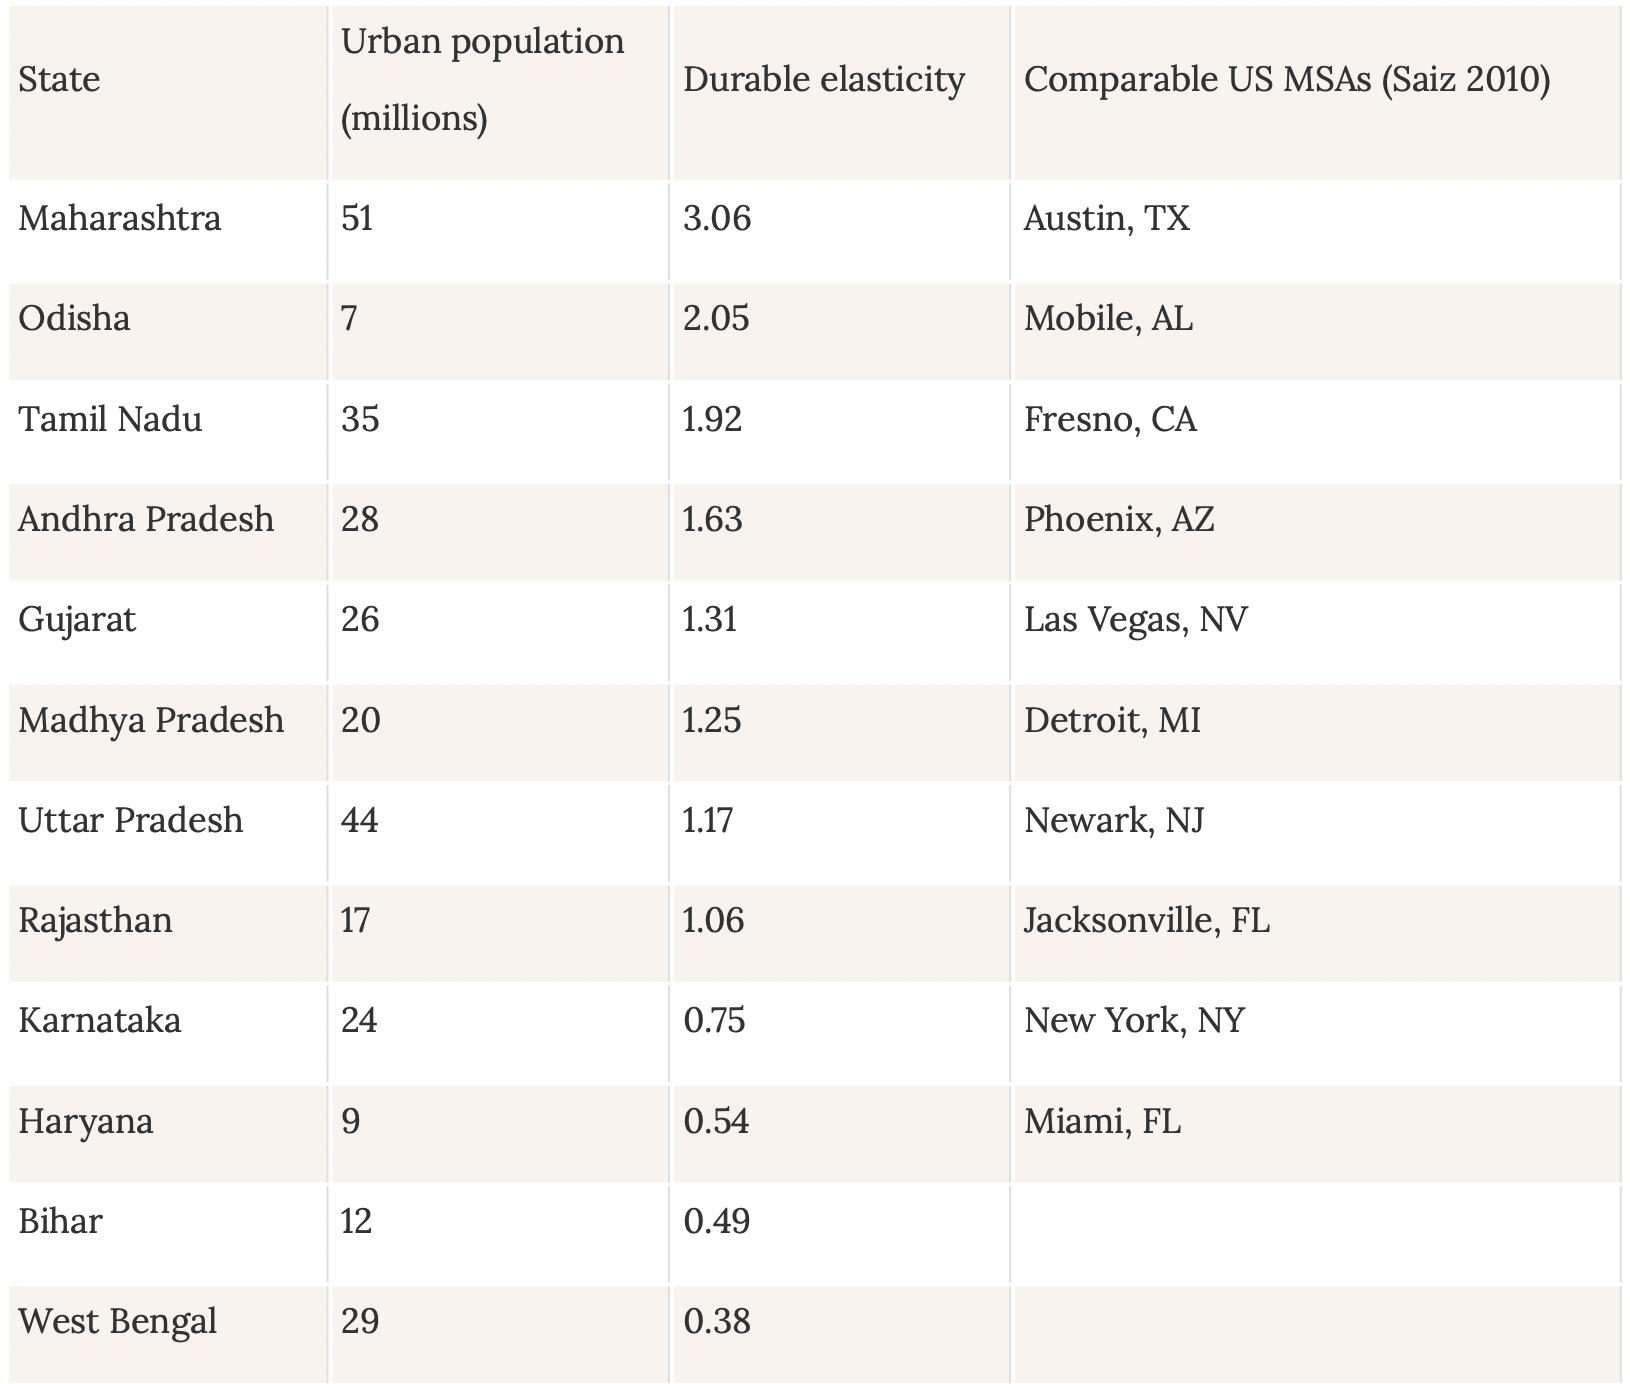
We estimate state-level formal housing supply elasticities for 12 of the largest states in India. We present these elasticity figures in Table 1 and compare them to equivalent US metropolitan statistical areas (MSAs) based on Saiz (2010). In the absence of prior literature on housing supply elasticities in India, the US elasticity estimates provide a benchmark for us to understand how well India’s urban markets supply housing when prices change. Maharashtra has the highest durable housing supply elasticity in India, with a value of 3.06, similar to Austin’s in the US. Bihar and West Bengal have the lowest elasticities, with values of 0.49 and 0.38, respectively. These long-run elasticity values are lower than the US’ least supply elastic MSAs: Miami and Los Angeles-Long Beach. Miami and Los Angeles are both hemmed in by natural barriers, and so have particularly low supply elasticities. This makes even lower elasticities for Bihar and West Bengal all the more striking.
Table 1. State-level elasticity of housing supply
Also read: Housing sales in metros decline 15 pc in April-June quarter
Implications for housing supply and land-use regulations
Some state-level elasticity estimates presented in Table 1 do not necessarily correspond to existing land-use regulations across Indian states. Consider the case of building height restrictions which are ubiquitous in India (Bertaud and Brueckner 2005). Regulators impose building height restrictions by limiting the allowable floor-area ratio (FAR)7 or the amount of floor space that builders and developers can build on a plot of land. Maharashtra has the lowest permissible floor area ratio (FAR) in India, with an average of 1.3, yet it has the highest housing supply elasticity. On the other hand, the average FAR in West Bengal is 3, yet it has the lowest supply elasticity. One possible reason behind this anomaly is that cities in Maharashtra allow developers to purchase additional FAR through transferable development rights (TDR)8, which is why the effective FAR in cities like Mumbai (the capital of Maharashtra) is higher than the freely available FAR. West Bengal has no such provision.
The relatively low elasticity figures in high-FAR states like Karnataka and Andhra Pradesh compared to low-FAR Tamil Nadu underscores the need to study the impact of other land-use regulations that affect housing supply.9 Examples of such regulations include the Urban Land (Ceiling and Regulation) Act of 1976, which restricts individuals and businesses from holding more than a certain amount of vacant urban land and was in force in Andhra Pradesh until 2008; and the Karnataka Land Revenue Act of 1964, which until very recently prohibited non-residents from converting agricultural land to be used for non-agricultural purposes, thereby limiting the ability of real estate developers that did not own agricultural land to initiate construction projects on the peripheries of cities such as Bengaluru.
Notes:
- Supply elasticity figures here refer to the percentage change in supply of housing with a percentage change in its market price.
- Instrumental variables are used in empirical analysis to address endogeneity concerns. An instrument is an additional factor that allows us to see the true causal relationship between the explanatory factor and the outcome of interest. It is correlated with the explanatory factor but does not directly affect the outcome of interest.
- Spatial equilibrium implies that any interregional differences in wages and land rents, adjusting for space-based amenities such as climate, air quality, linguistic proximity, place-based policies, etc., are eliminated through interregional migration (Roback 1982, Rosen 1979). At this equilibrium, individuals are indifferent to the region in which they live, so there are no gains to mobility. Hence, adjusting for space-based amenities, net interregional migration is zero in a spatial equilibrium framework. Exogenous events, such as technological shocks or droughts, can upend individuals’ indifference, and therefore induce migration (Boustan 2010).
- The Golden Quadrilateral (GQ) or the National Highways Development Project-Phase I (NHDP I) was introduced as a highway upgrade programme by the central government in 2000, and came into effect in 2001. Its primary goal was to upgrade pre-existing highways connecting the four largest metropolitan areas of India – Delhi, Mumbai, Kolkata, and Chennai – from two lanes to four lanes. For details on economic effects of the GQ program, see Ghani et al. (2016) and Abeberese and Chen (2021).
- The FAR of a building is equal to its total floor area divided by the area of the land parcel on which it is built. Lower FAR values lead to low building height and implies stricter building regulations.
- TDRs are certificates issued by relevant authorities to an owner of a plot of land for surrendering the gross area of the land to the government for public purposes. TDRs confer additional FAR credit which can be sold at an ongoing market price (Gupta 2020). Developers can purchase TDRs and get the rights to construct additional floor space above the otherwise maximum permissible limit set by building regulations.
- During the late 2000s, the average floor-area ratio in Andhra Pradesh, Karnataka, and Tamil Nadu was 2.3, 2.4, and 1.8, respectively (Sridhar 2010).
Arnab Dutta is a Ph.D. candidate in Urban Planning and Development at the Price School of Public Policy, University of Southern California.
Sahil Gandhi is a lecturer at the School of Environment, Education and Development, University of Manchester. He tweets @gandhisahil.
Richard K Green is Professor at the University of Southern California Sol Price School of Public Policy and the Marshall School of Business. He tweets @keynesianr.
This article was first published by the Ideas For India (I4I).