


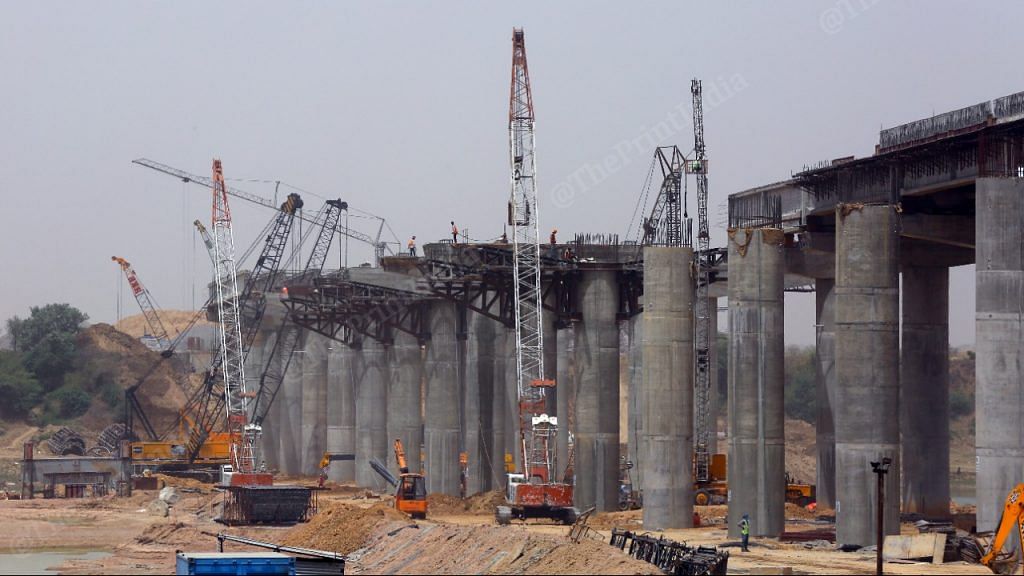
With the ongoing assembly election in Uttar Pradesh ready to witness the third phase of polling on 20 February, covering the Bundelkhand region, we shift our focus towards the economies of a region that is often ignored in economic discussions. Earlier, we looked into Western and Eastern regions of Uttar Pradesh. Our study of district domestic product data for 14 districts of Bundelkhand — 7 in Uttar Pradesh and 7 in Madhya Pradesh — reveals a startling finding. While MP-Bundelkhand has grown significantly in the previous decade, growth in UP-Bundelkhand has stagnated, with the former region even having surpassed the latter.
Interestingly, the ongoing assembly election has not seen the demand for a separate state of Bundelkhand, which used to be an important regional issue in earlier polls. The statehood demand arises from the sentiment that Bundelkhand has been on the periphery in terms of development efforts — in administrative and political aspects — allegedly rendering the region as one of the poorest in socio-economic terms.
In this article, we examine the economies of the Bundelkhand region on both sides of the state boundaries, with special focus on UP-Bundelkhand. Specifically, we see how the UP-Bundelkhand region’s economy compares with the whole state of Uttar Pradesh. We then analyse where UP-Bundelkhand stands relative to Madhya Pradesh part of Bundelkhand. This comparison provides an interesting contrast in terms of a homogeneous socio-cultural and economic region, separated by a state boundary.
Also read: CM says UP will be largest economy if BJP wins. Data shows unlikely for a decade or two
An overview of the Bundelkhand region
Bundelkhand is a homogeneous agro-climatic and socio-cultural region situated in north-central part of India. It comprises 7 districts of Madhya Pradesh (Chhatarpur, Damoh, Datia, Niwari, Panna, Sagar, and Tikamgarh) and 7 districts of Uttar Pradesh (Banda, Chitrakoot, Hamirpur, Jalaun, Jhansi, Lalitpur, and Mahoba). The region shares a common culture, and has historically been a part of unified kingdoms — like Chandelas and Bundelas — before becoming a part of the British Empire. Post-Independence, the region was partitioned between the states of MP and UP on the recommendation of States Reorganisation Commission. The two regions are so inter-mingled that two of the UP-Bundelkhand districts — Jhansi and Lalitpur — form an island in MP. The rest of the Bundelkhand districts in these two states run parallel to each other in the north (UP) and the south (MP).
A state boundary dividing such a homogeneous region has an important political implication. It dilutes the relative political power of the region in their respective states. This could have been one of the reasons for the lower economic and human development outcomes in Bundelkhand. In the recent past, the region has been affected by prolonged droughts and abnormal rainfall wreaking havoc in Bundelkhand’s economy, which is predominantly agrarian clubbed with informal services. Interestingly, due to its dependence on Minimum Support Price (MSP), the region majorly produces wheat and paddy, unsuitable for water scarce and monsoon dependent areas.
According to the Human Development Report of Bundelkhand, published by UNDP in 2012, Bundelkhand is among the most backward regions in central India, having the lowest development indicators in the country in some sectors.
UP-Bundelkhand had a higher Human Development Index (HDI) score (0.493) than the whole of UP (0.397). This, however, is quite lower than the national average (0.632). Among the 14 districts, Jhansi has the highest HDI (0.592). The best performing district in MP-Bundelkhand (Sagar) was ranked fifth among the 14 districts of the Bundelkhand region. This was in line with the relatively worse economic position of MP-Bundelkhand in the mid-2000s when the data was used to construct the index values. However, as we shall see in this article, MP-Bundelkhand has outperformed its UP counterpart in the previous decade. This calls for a revisit of the HDI exercise with more recent data. We expect changes in the relative position of the districts and the two regions.
Also read: Rise of Gorakhpur, fall of Mathura – How UP’s temple towns contribute to economy
Data and methods
We employ data from the Gross District Domestic Product (GDDP) provided by the Directorate of Economics and Statistics (DES) of the two states: Uttar Pradesh and Madhya Pradesh. This data is available only from 2011-12 till 2016-17 (for MP) and till 2019-20 (for UP). In addition, we also employ data from earlier years (since 2004-05) in a couple of our graphs. A caveat: the data across these two series may not be strictly comparable on account of different methodologies. However, we may gain some insights while comparing the trends using these different series with respect to their own states. We use current prices data throughout our analysis.
We compute shares of aggregate economy as well as various sectors of the two Bundelkhands as percentage of their respective states. We also compute the share of the various sectors of MP-Bundelkhand as percentage of UP-Bundelkhand. It explicitly presents how the MP side is growing vis-à-vis the UP side. To arrive at regional-level estimates, we aggregate district data.
How is UP-Bundelkhand doing?
How large is the economic size of UP-Bundelkhand relative to the state of UP? To gauge this, we plot the share of the economy of UP-Bundelkhand over the last decade in Figure 1. In addition, we also plot the shares of five specific sectors: agriculture and allied activities, manufacturing, construction, trade and hotels, and real estate sector. It may be worthwhile to note that UP-Bundelkhand region is the smallest of the four regions of UP, in terms of both area and population. According to Census 2011, the region had a population of 9.7 million, around 5 per cent of UP’s population. It covers an area of 29,417 square km, which is just 12 per cent of the state’s area. As can be clearly seen, the region is relatively sparsely populated.
Figure 1: Share of UP-Bundelkhand in Uttar Pradesh’s overall economy

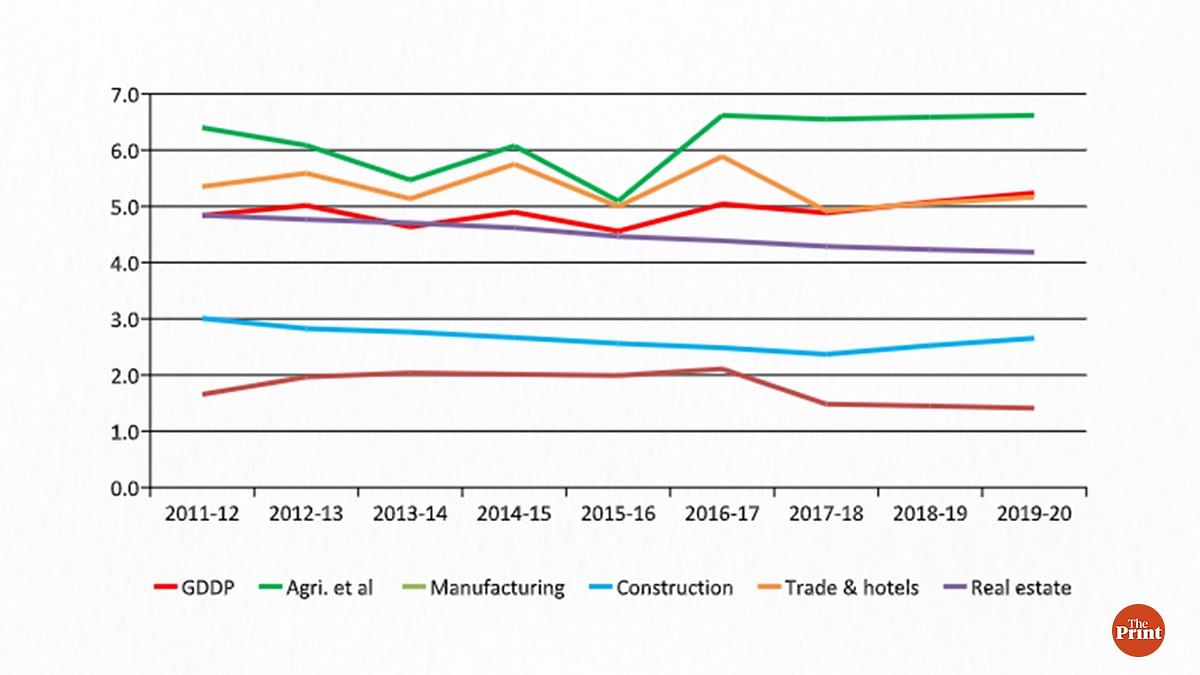
In the previous decade, the region’s contribution in UP’s economy hovered around a low value of 5 per cent, roughly about the share of its population. The contribution of different sectors is also quite low. Agriculture contributed only about 6.6 per cent of the state’s total agricultural production. This share has been fluctuating between 5 to 7 per cent in the last decade, perhaps on the account of frequent droughts that the region faces. It is important to note that in 2015-16, only 8 per cent of net cropped area (NCA) was irrigated in Bundelkhand compared to 41 per cent in Western UP and 32 per cent in Eastern UP, showing the vulnerability of the region due largely to erratic rainfall and lack of irrigation facilities.
The share of the manufacturing sector has been abysmally low, hovering somewhere between 1 and 2 per cent. This has been plummeting since 2016-17 and accounts for just 1.4 per cent of UP’s manufacturing sector in 2019-20. The share of the real estate sector has seen a consistent decline over the years, carving a straight line with negative slope. It fell from around 5 per cent (2011-12) to 4.2 per cent (2019-20). The share of trade, hotels, and the restaurant sectors has fluctuated in the 5-6 per cent range. On account of the region’s low population, the per capita income (PCI) is comparable to that of UP.
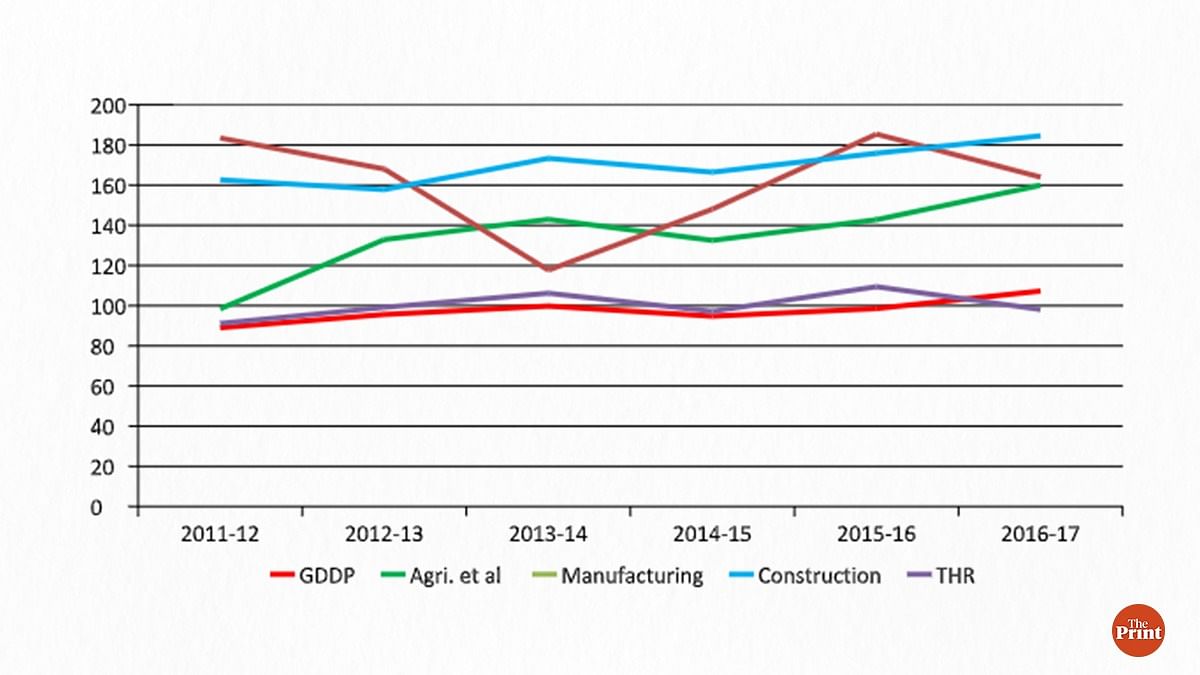
What is the relative contribution of various sectors within the region’s economy? We plot shares of five select sectors in Figure 2. Bundelkhand is predominantly an agrarian economy. According to Census 2011, over two-thirds (70 per cent) of the working-age population are engaged in agricultural activities. This sector contributes to roughly a third of the region’s economy. This share stood at 31 per cent in 2019-20. The divergence between primary sector and agriculture implies that there has been significant growth in mining and quarrying activities in the region in recent years. What could have caused this requires deeper investigation.
Figure 2: Contribution of various sectors in UP-Bundelkhand’s economy
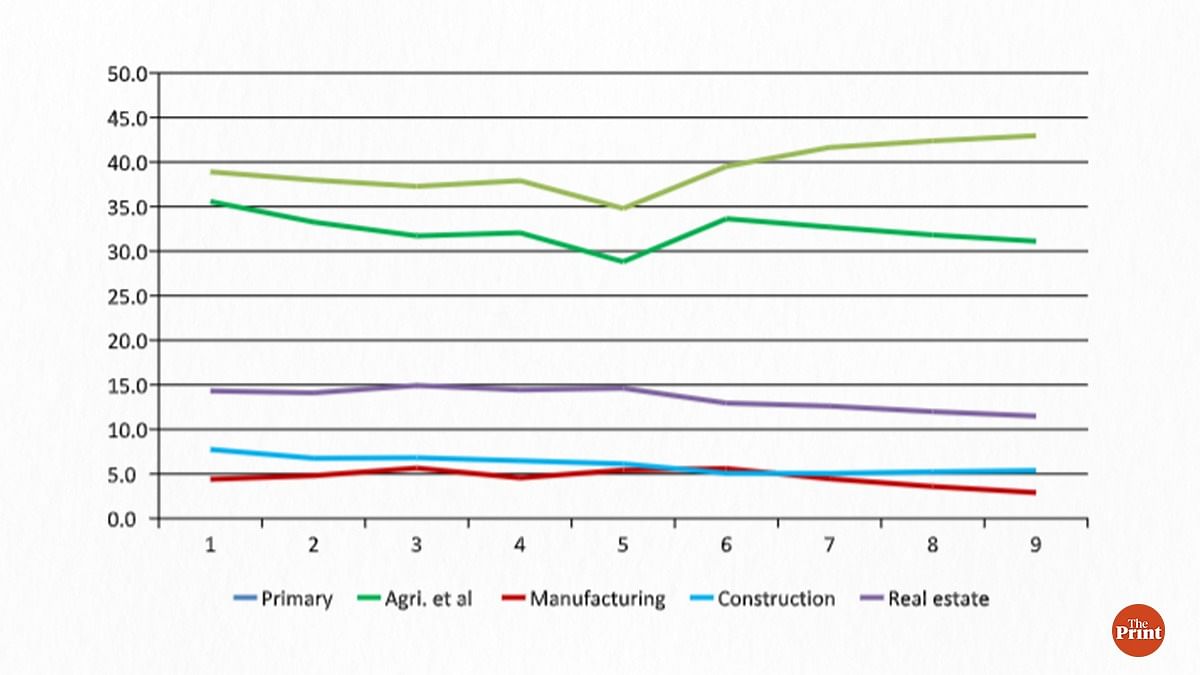
The share of manufacturing in the region’s economy — also reflected in its negligible share in the state’s economy — was hovering around 5 per cent in the early part of the previous decade. This has slowly been declining and contributed just 2.9 per cent in 2019-20. This low presence of the manufacturing sector could have been one of the reasons for outmigration. An important reason often given for the lack of industrial investment is the poor law and order situation in the region. The largely informal services sector (not shown in graph) plays an important part and contributes to about half of the economy.
Also read: Water woes are peaking in Bundelkhand and it’s a ‘bigger crisis than Covid can ever be’
How does UP-Bundelkhand compare with MP-Bundelkhand?
An Interesting pattern emerges when we compare Uttar Pradesh part of Bundelkhand to its counterpart in Madhya Pradesh (Figure 3). The economic size of MP-Bundelkhand was roughly around 80 per cent over the late 2000s. This has undergone a dramatic change over the previous decade. MP-Bundelkhand bridged its gap with UP-Bundelkhand in the first half of 2010s, and then it swiftly surpassed it. In 2019-20, MP-Bundelkhand’s economic size is 15 per cent higher than UP-Bundelkhand’s.
Figure 3: Aggregate economy and per capita income of MP-Bundelkhand as percentage UP-Bundelkhand
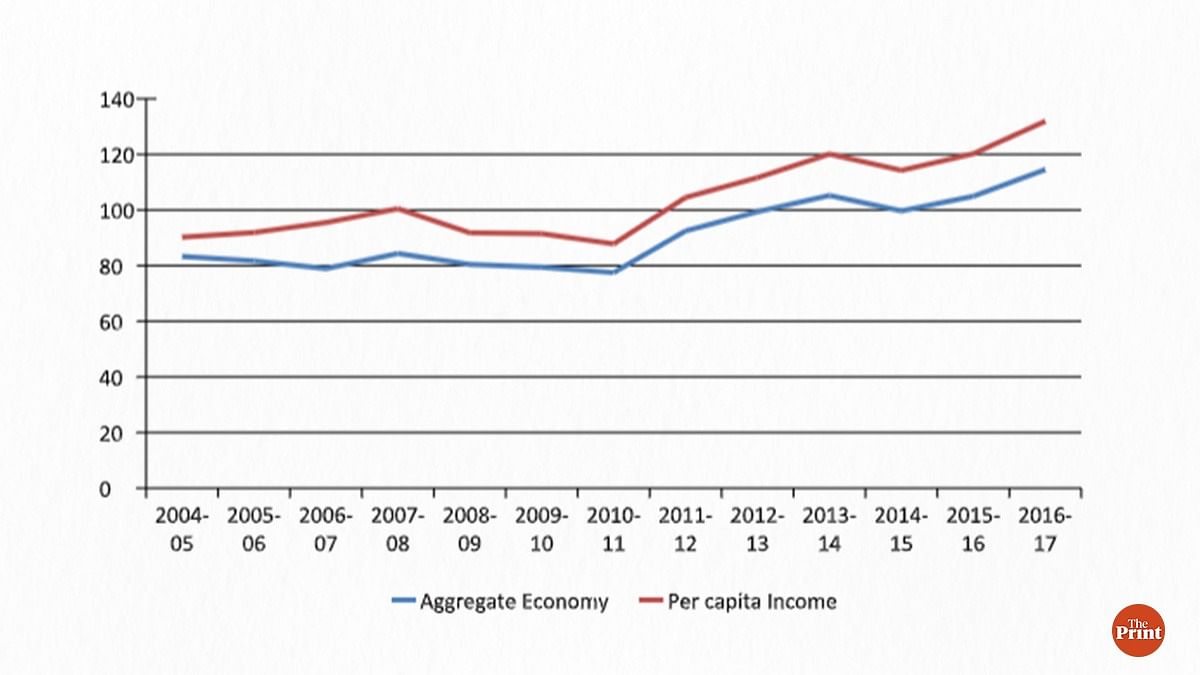
What about the per capita income across the state boundary? During the 2000s, MP-Bundelkhand was lagging behind the UP side. In less than a decade’s time, it bridged the gap and surpassed it. In 2019-20, the MP side is 1.3 times the per capita income of the UP side. Although the two decades — 2000s and 2010s — may not be strictly comparable on account of changing methodologies, the trend is too perceptible to ignore.
Which sectors have contributed to the rise of MP-Bundelkhand relative to UP-Bundelkhand? In Figure 4 we plot the relative sizes of four specific sectors of MP-Bundelkhand as percentage of UP-Bundelkhand. For ease of reference, we also show the aggregate size of the economy.
Figure 4: MP-Bundelkhand’s economy as percentage of UP-BUndelkhand
In 2011-12, the agricultural output in both regions was roughly equal. This has diverged over the previous decade. By 2016-17 — the latest year for which data for MP-Bundelkhand is available — MP-Bundelkhand’s agricultural output climbed up to 1.6 times the UP-Bundelkhand’s. Given that agriculture is the major sector in the economy of both the regions, it stands clear that the rise in economy, as well as per capita income, of MP-Bundelkhand is largely on account of the agriculture sector.
The manufacturing sector — even though contributing a very small proportion to both the regions — is relatively larger in MP-Bundelkhand. The sector has shown large fluctuations over the years. Two other sectors — construction and trade, hotel and restaurant — have grown relatively faster in MP-Bundelkhand.
Also read: Kerala’s poor is UP’s rich — how access to basic services varies in Indian states
Economic disparity among seven districts of UP-Bundelkhand
We now shift our attention to the seven constituent districts of UP-Bundelkhand. We plot the per capita income of these seven districts, as well as the whole region, as percentage of the state (Figure 5). The per capita income of UP-Bundelkhand has roughly been around the state’s average. Judged on this metric, the region does not appear to have lost out with respect to the state’s average. It may be pertinent to note here that UP has among the lowest per capita income across Indian states. Also, it is important to keep in mind that the region has the lowest population density across the four regions of UP. According to Census 2011, the region’s population density was 329 people per square km, as against the state’s average of 829.
Figure 5: Per capita income of UP-Bundelkhand district as percentage of UP
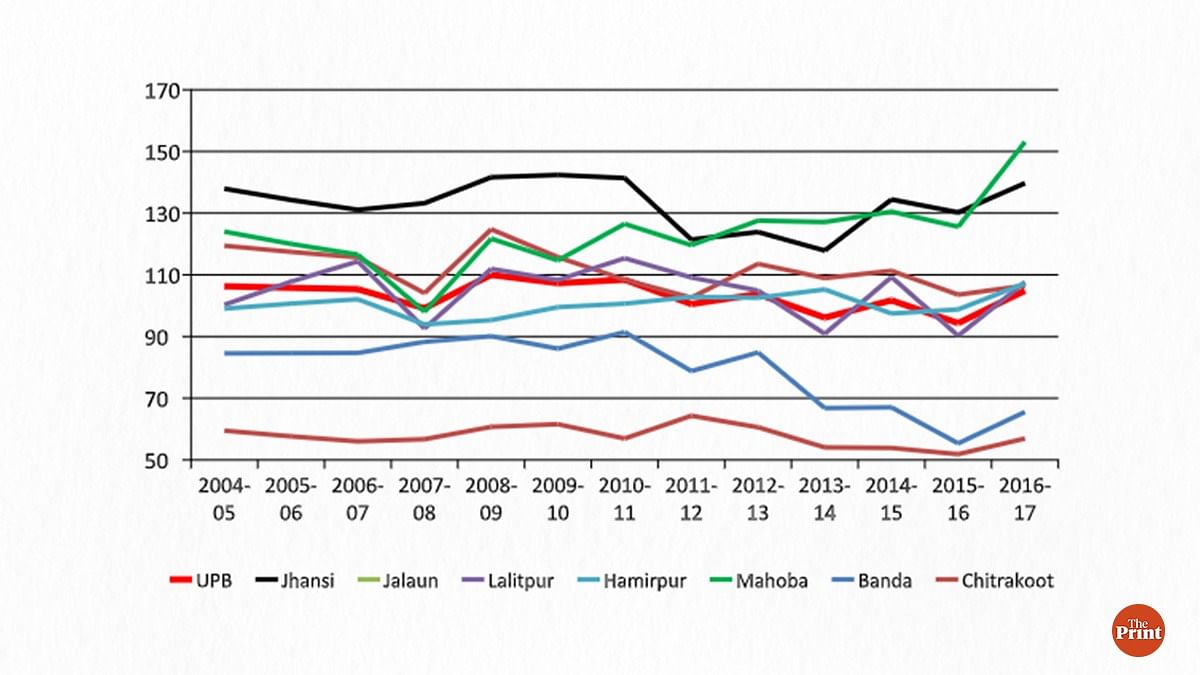
The graph also points towards a huge economic disparity across the seven constituent districts. In 2016-17 five of the seven districts had higher per capita income (PCI) than the state’s average. Jhansi and Mahoba districts have the highest PCI in the region. In 2016-17, Jhansi’s PCI was 1.4 times that of UP. This is mainly attributed to the district’s geographical location as it is well connected to other cities via road and railway. The service sector contributes almost half to the district’s economy, whereas the agricultural sector contributes less than a third. The share of the manufacturing sector has hovered around 10 per cent. Though very low, it is highest among all the seven UP-Bundelkhand districts.
The economy of Mahoba district is largely driven by the primary sector, which contributed to around 50 per cent of the district’s economy in 2019-20. Interestingly, the share of the mining and quarrying sector in the district’s economy has steadily been increasing. In 2011-12, this sector accounted for 8 per cent of Mahoba’s economy, which increased to around 28 per cent in 2016-17. The mining & quarrying of Mahoba contributed only 4 per cent to the state’s mining & quarrying sector in 2011-12, which steadily jumped to 17 per cent in 2016-17.
The per capita income of Lalitpur, Hamirpur, and Jalaun districts has hovered around the state’s average, without any dramatic change in the period under consideration. Also, there has not been any significant change in the economic structure of these three districts. A common feature is the really low share of manufacturing in the three districts’ economy. For instance, the share of manufacturing sector in Lalitpur hovered around 2 per cent. For Hamirpur, it was between 5-7 per cent.
The per capita income of Chitrakoot has been consistently lowest in the region. It is less than two-thirds of Uttar Pradesh’s average. An even worrying aspect is the slow and steady decline since 2011-12. Banda district’s decline is especially worrisome, falling from 85 per cent in 2011-12 to just 65 per cent in 2016-17, largely due to the performance of the primary sector.
Also read: What do UP voters want? This is what they told me about cow, Covid, Kashi
Conclusion
Bundelkhand region is often bypassed in any discussion on economic development. Also, it is thought of as an economically homogeneous region. Contrary to this popular perception, we find that Bundelkhand has undergone significant change. MP-Bundelkhand is silently increasing its economic might, powered by its agricultural sector. Starting from playing a second fiddle to its UP counterpart, MP-Bundelkhand has emerged as a story of economic revival. What policies led to such a fortune reversal needs a deeper probing.
The fortune of UP-Bundelkhand, on the other hand, seems to have stagnated, if not deteriorated. The region has a negligible presence of the manufacturing sector. Agriculture, too, has relatively suffered. The per capita income of some of the UP-Bundelkhand districts is abysmally low, and has been declining, even relative to that of UP. There is a need to take an economic lesson from the neighbour just across the state border. The future policies must also focus on the inter-district disparity in UP-Bundelkhand region.
Shraddha Yadav is a PhD Research Scholar, Indira Gandhi Institute of Development Research (IGIDR), Mumbai.
Vikash Vaibhav is Assistant Professor, Dr B.R. Ambedkar University, Bengaluru. He tweets @VikashVikashv.
Varun Kumar Das is Assistant Professor, Delhi School of Economics. Views are personal.
This article is part of the ‘UP in numbers’ series. Read all the articles here.
(Edited by Prashant)