


New Delhi: Karnataka is one of the richest states in India on a per capita income basis. Yet, ‘freebies’ for the poor have dominated the poll promises of all political parties in the state, which votes on 10 May — whether it’s the BJP’s pledge of free milk and gas to below-poverty-line families, or the Congress’s assurance of financial doles.
The answer to this apparent paradox lies in the state’s unequal growth, mostly arising from the disproportionate contribution of Bengaluru Urban district.
According to the RBI’s handbook on Indian states, Karnataka’s per capita income in 2020-21 was Rs 2.364 lakh, the highest among states with a population of more than 1 crore (if Delhi is excluded). Since the latest compiled data for all states was not available at the RBI’s repository, we limit the per capita income numbers to the financial year 2020-21.
However, the Karnataka Economic Survey 2022-23 shows that more than 36 per cent of the state’s gross domestic product (GDP) — the total value of final goods and services — in 2021-22 came from Bengaluru Urban district.
The district, home to approximately 96 lakh people according to figures from the district statistical office, comprises just about a sixth of the state’s population of about 6.10 crore (per 2011 Census).
This disparity illustrates that the per capita income of a state does not necessarily reflect the economic conditions and income distribution across its population. Further, despite the apparent prosperity of Karnataka, there are still significant pockets of poverty and income inequality.
Also read: Prosperous Maharashtra, Karnataka hide a disparity within. Development is not for all
Karnataka’s per capita income climb
Karnataka’s ascent among the top states in terms of per capita income — measured as net domestic product, or the average economic output/income generated per person in a year— is a relatively recent phenomenon.
At current prices, the state’s per capita income was reported at Rs 2.364 lakh for the fiscal year 2020-21, second only to Delhi at Rs 3.44 lakh.
This is especially notable considering that in 2011-2012, Karnataka was ranked seventh in terms of per capita income.
In the previous decade, the ascent of Karnataka’s per capita income has been marked by significant milestones.
In 2013-14, the state overtook Tamil Nadu, and by 2015-16, it surpassed Uttarakhand and Maharashtra, securing the fourth rank.
By 2016-17, Karnataka’s per capita income had even outpaced that of Kerala, claiming the third rank.
Finally, in 2021-22, Karnataka overtook Haryana, becoming the state with the highest per capita income (excluding Delhi, which is a Union territory).
The economic powerhouse of Bengaluru Urban, often referred to as India’s Silicon Valley, has had a huge part to play in Karnataka’s performance on this front. Accounting for an impressive Rs 7 lakh crore in economic activities for 2021-22, it constituted about 36 percent of Karnataka’s GDP for the same period.
Simply put, in the absence of this district, Karnataka’s economy would shrink by 36 per cent.
So, where does that leave the state’s remaining districts?
According to data from the 2022-23 Karnataka Economic Survey, none of the state’s remaining 29 districts individually contributed even 10 per cent to its Gross State Domestic Product (GSDP).
Comparatively, India’s financial capital Mumbai (including Mumbai Suburban), contributes only 19 per cent to the GSDP generated by all districts in Maharashtra. Pune and Thane each account for another 12 per cent. Thus, there appears to be a relatively better distribution of economic output in specific areas of Maharashtra, which is conspicuously absent in Karnataka.
Another noteworthy aspect of Karnataka’s economy is the heavy reliance on agriculture in the majority of its districts.
Bengaluru Urban’s agriculture sector contributes a meagre 0.5 per cent to its GDP, whereas in all other districts, agriculture makes up at least 10 per cent. For Yadgir, one of the poorest districts, agriculture contributes about 50 per cent of the GDP.
Low on unemployment, but high on poverty?
There’s another apparent paradox at play in Karnataka — a low unemployment rate, but a high prevalence of poverty.
India’s official poverty estimates, last released for the year 2011-12, indicate that approximately one in five individuals in Karnataka (around 20 per cent of the population), remains below the poverty line.
This translates to about 1.3 crore people earning less than Rs 902 and Rs 1,098 per month in rural and urban areas of Karnataka, respectively.
Further, Karnataka ranks eighth among the top 10 most populous states (those with a population of more than 1 crore) with the highest poverty rates.

According to the government’s poverty estimates, Chhattisgarh has the highest poverty ratio among larger states, with nearly 39 per cent (or 1 crore) of its population living below the poverty threshold. This is followed by Jharkhand, Bihar, Odisha, Assam, Madhya Pradesh, and Uttar Pradesh.
Karnataka’s poverty headcount ratio is slightly below the national average of 21.9 per cent. However, there is a rural-urban disparity.
In comparison to the national average of 25.7 per cent, rural poverty in Karnataka is relatively lower at 24.53 per cent. On the other hand, in urban areas, Karnataka’s poverty ratio stands at 15.25 percent, slightly above the all-India average of 13.7 per cent.
Meanwhile, despite the high incidence of poverty, Karnataka also lays claim to having one of the lowest unemployment rates in the nation.

According to the Periodic Labour Force Survey (PLFS) data published by the Ministry of Statistics and Programme Implementation, only 3.2 per cent of individuals aged 15 and above were reported as unemployed in Karnataka for the year 2021-22.
This stands in contrast to the national average of 4.1 percent. In comparison, Karnataka’s neighbour Kerala bears the burden of the highest unemployment rate in the country, hovering around 9.6 per cent. Haryana follows closely behind at 9 per cent, while Uttarakhand records 7.8 per cent and Punjab 6.4 per cent.
What explains poverty in Karnataka?
Why does Karnataka grapple with such elevated poverty estimates? One plausible explanation lies in the fact that the poverty numbers themselves are a decade old.
While efforts have been made to provide more recent poverty estimates, such as the NITI Aayog’s Multidimensional Poverty Index — which suggests that only 13 per cent of the population is considered poor in Karnataka — the 2011-12 figures continue to be influential in shaping policies such as the National Food Security Act (NFSA), which provides free foodgrains.
In 2017-18, the government rejected the estimates derived from its own quinquennial Consumption Expenditure Survey, thereby impeding the establishment of a new poverty line for India.
Although various attempts have been made to calculate poverty using hypotheses or proxy data, none hold binding authority, rendering them mere shots in the dark.
However, intra-state disparities in India’s more prosperous states are well documented, including the fact that Karnataka’s income growth story is largely tied to the performance of Bengaluru Urban and its IT sector boom.
Santosh Mehrotra, a development economist at Jawaharlal Nehru University in Delhi, suggests that Karnataka’s seemingly high per capita income may be deceptive due to the underlying inequalities within the state.
“The per capita income of Karnataka is anchored by its urban centres, particularly Bengaluru. Beyond that, the state is primarily dependent on agriculture and that often gets missed in its overall statistics because the contribution of the services sector by a relatively smaller sized population drives up its numbers,” he said.
“Income inequality is extremely difficult to measure, but my hunch is that high per capita incomes, when coupled with high poverty rates, generally reflect significant levels of income inequality,” Mehrotra added.
District-by-district per capita income figures for 2021-22, the latest year for which this data is available, from the Karnataka Economic Survey bear this out.

With a per capita income of Rs 6.2 lakh, Bengaluru Urban residents boast the highest GDP per capita in Karnataka. They are followed by the districts of Dakshina Kannada (4.4 lakh), Udupi (3.7 lakh), Chikkamangaluru (3.34 lakh), Bengaluru Rural (3.19 lakh), and Shivamogga (2.7 lakh).
The remaining 24 districts have reported a per capita income lower than the state’s average of Rs. 2.65 lakh. Kalaburagi has the lowest per capita income at just Rs 1.25 lakh.
Rapid GSDP growth
Karnataka’s leaps in per capita income correspond to its growth in total output.
Over the past five years, the state has consistently exceeded the national average growth rate in its Gross State Domestic Product (GSDP), or the value of all economic activities produced each year.
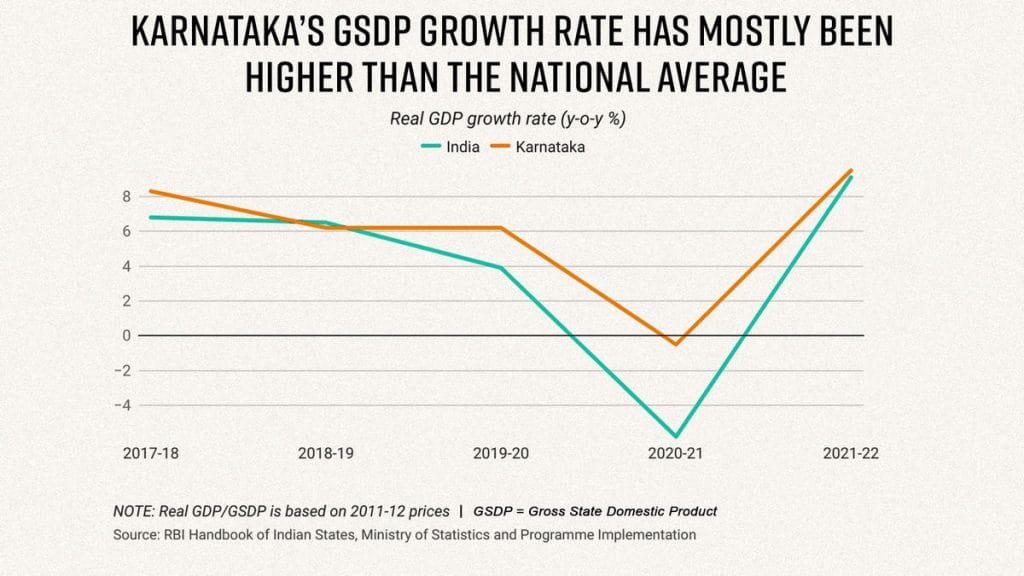
In 2017-18, Karnataka’s GSDP experienced a robust growth of approximately 8.3 per cent at 2011-12 prices, surpassing India’s overall GDP growth of 6.8 per cent that year.
Looking at constant prices with a base year— in this case, 2011-12 — is useful to account for the impact of inflation when looking across time periods. However, when analysing rankings for states at a single point of time, it is more useful to look at current prices.
In 2018-19, while India’s GDP grew by 6.5 per cent, Karnataka’s growth rate slightly dipped below the national average, reaching 6.2 per cent.
However, in 2019-20, when India’s GDP growth rate plummeted to 3.9 per cent, Karnataka surged ahead with a remarkable growth rate of 10.8 per cent.
Amid the Covid pandemic in 2020-21, the Indian economy contracted by 5.8 per cent, but Karnataka managed to limit the damage. The state’s economic activities shrank by a mere 0.5 per cent that year.
In 2021-22, India’s GDP grew by 9.1 per cent and Karnataka’s by 9.5 per cent.
Karnataka’s resilience in the face of the pandemic could have been driven by Bengaluru’s large share of the GSDP. Driven by the thriving IT services sector, Bengaluru likely balanced the contraction in economic activity seen in the rest of the state due to the pandemic.
(Edited by Asavari Singh)
Also read: With its infra crumbling & green cover eroding, Bengaluru may vote over same issues in elections