Using govt statistics, ThePrint simplifies BJP’s graphics by separating absolute prices and percentage increase into individual graphs.
New Delhi: The Bharatiya Janata Party (BJP) Monday tried to tide over the furore over rising fuel prices with facts but found itself in the middle of a severe social media backlash after it tweeted two infographics under the title ‘Truth of hike in petroleum prices’.
Truth of hike in petrol prices! pic.twitter.com/hES7murfIL
— BJP (@BJP4India) September 10, 2018
Truth of hike in diesel prices! pic.twitter.com/gF7CWHeiti
— BJP (@BJP4India) September 10, 2018
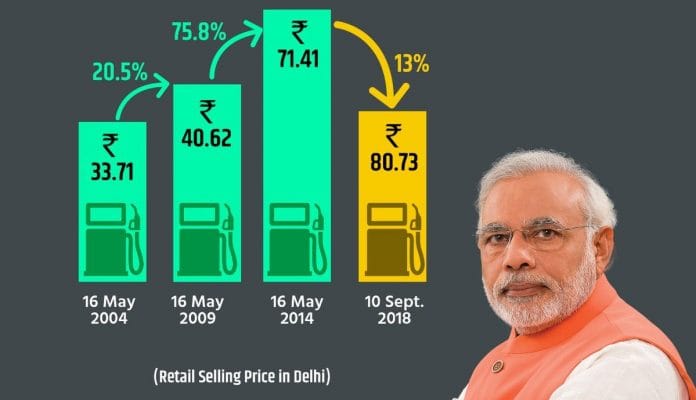
The party put out the two graphs seeking to convey that the percentage increase in fuel prices during the UPA government (2004-2014) was higher than during the Narendra Modi-led NDA government.
The graphics, however, seemed to have confused people as data for both the prices and the percentage increase was put together in a single bar chart.
Also read: Data shows Modi-led BJP can’t bend too much to please upper caste vote base
Real picture
Using statistics available with the Petroleum Planning and Analysis Cell under the Ministry of Petroleum and Natural Gas, ThePrint simplifies the graphics by separating absolute fuel prices and their percentage increase into individual graphs.
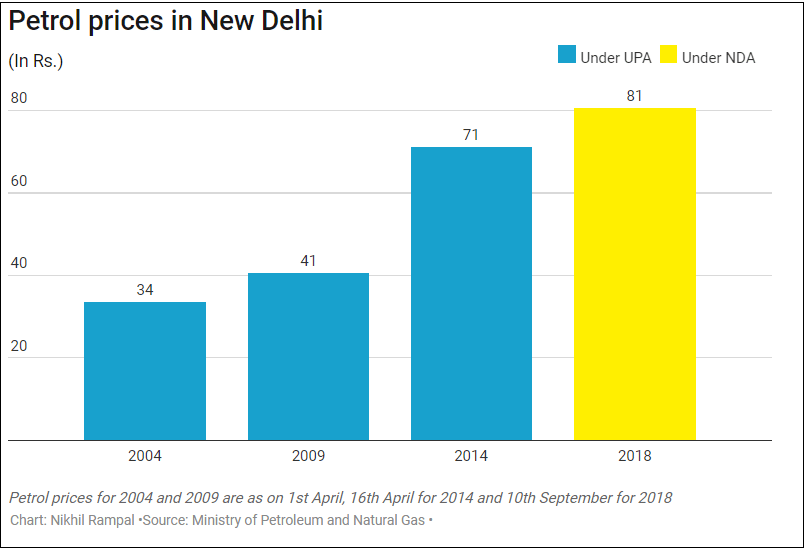
 The retail selling price of petrol rose from Rs 33.71 in 2004 to Rs 71.41 in 2014 under the UPA. Under the Modi government, the price rose from Rs 71.41 to Rs 80.73 between 2014 and 2018. (All prices are from New Delhi.)

So the percentage increase in petrol prices was higher under the UPA government as compared to NDA. Between 2004 and 2009, the petrol prices rose by 20.5%, and 75.8% during 2009-14. However, the increase narrowed to 13.05% between 2014 and 2018.
It’s a similar story for diesel.

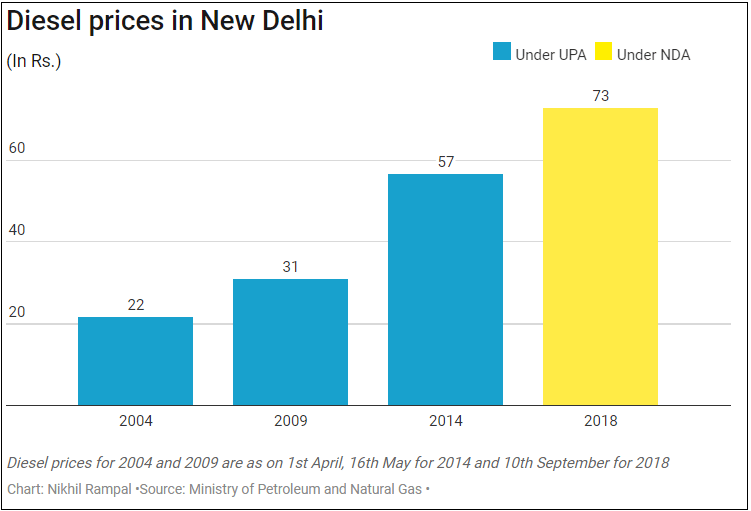
The retail selling price of diesel rose from Rs 21.74 in 2004 to Rs 56.71 in 2014. From 2014 to 2018, the price rose to Rs 72.83.

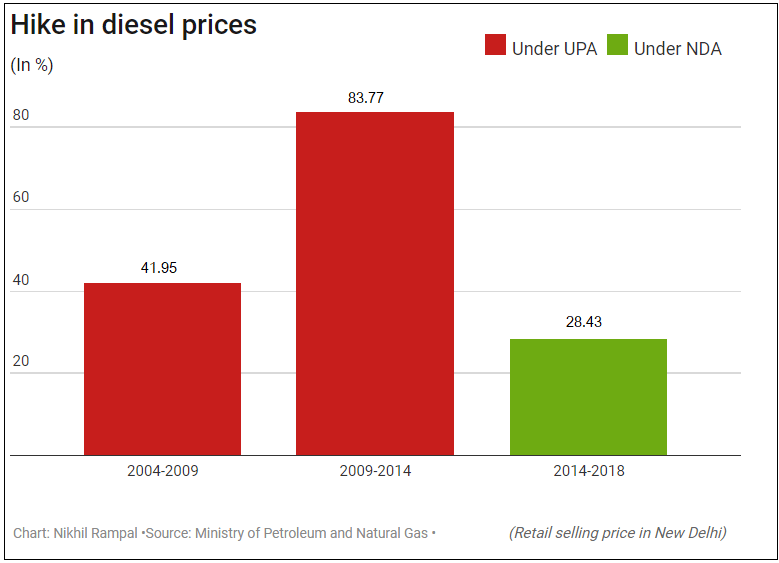
As with petrol, the percentage increase in diesel prices during the UPA government was higher as compared to NDA. The increase between 2004 and 2009 amounted to 41.95%, and 83.77% during 2009-14. However, the increase narrowed to 28.43 between 2014 and 2018.
Also read: Don’t shoot mouth off to media, Modi and Shah tell BJP leaders


The coloumnist should also show the prices of crude at least the average during the year and the amounts of excise duty in the price to come to a proper conclusion. The tables do not tell the whole truth. In 2014 crude oil prices were 108 $ when UPA demitted office and was an average of 50 $ during the NDA till lately.
Are fuel is sold in % or ₹. What about international crude price as compared to UPA era both in percentage and $. If Media like yours want to help BJP, a similar chart on Central Tax on fuel would clear the air. Percentage is always considered dubious if 1 of product x this and two following year one would claim 100% increase in sale as compared to last year.
Nikhil, do we write for the readers or for the BJP. Like the BJP you are presenting an incomplete picture. would you like to mention about what has been causing the rates to go up. Given that there were subsidies at one point in time and the consumer faced much lower price (despite international prices being higher). now the subsidies are gone and the taxes are @100%+ of the basic prices, who are we fooling? BJP has raised indirect taxes, which are regressive that too on petrol and diesel. Diesel hurts the economies as a while. where is the tax being collected on an inelastic product going? Farmers are suffering, real wages are not going up, stock market is doing well. Indian saver is being short changed – banks pay 6.5% and deposits and GOI pays 8% to foreign investors and the banks. Banks are being looted by the fat cats – belonging to parties of all colours. I am little surprised with the editorial oversight in the Print. last time you showed Pondicherry in North. now this half baked explanation on behalf of our political thugs.