






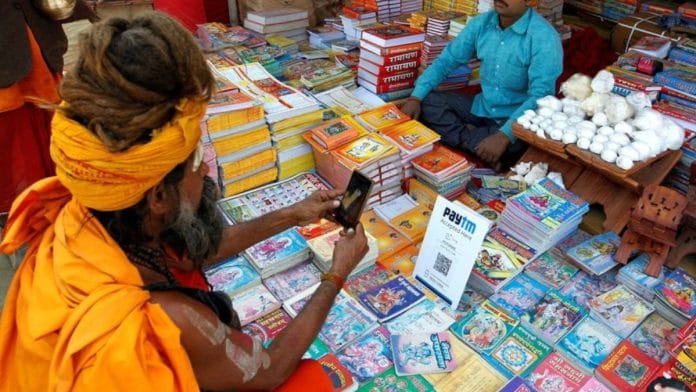


Buying vegetables or paying a rickshaw driver 10 years ago meant paying in cash. Today, however, a QR code does the job, and every transaction leaves a data trail. India’s Unified Payments Interface or UPI now processes more than 18 billion transactions a month, with the total transaction value surging from Rs 7,000 crore in Financial Year 2016-17 to approximately Rs 314 lakh crore in Financial Year 2025-26, marking a more than 4,000‑fold increase.
Yet this dataset is largely treated as a payments metric or numbers for budget speeches rather than a widely used high-frequency economic indicator. That is a missed opportunity, and an increasingly costly one.
The case for treating UPI intensity (monthly transaction value as a share of state domestic product) as a serious economic indicator rests on a simple intuition. If an economy is active, money moves. And in India today, money increasingly moves through UPI, whose share in digital payments has surged from 34 per cent in 2019 to over 83 per cent in 2024.
Unlike the Index of Industrial Production, which captures only manufacturing, or Purchasing Managers’ Index (PMI) surveys, which sample a fraction of firms, UPI flows cut across agriculture, services, retail, and B2B activity simultaneously. They update monthly, are not revised, and are granular enough to track regional heterogeneity that aggregate GDP estimates systematically obscure. A growing academic literature on nowcasting India’s GDP has accordingly turned to this high-frequency indicator that provides more timely signals.
How UPI data tells a story for every state
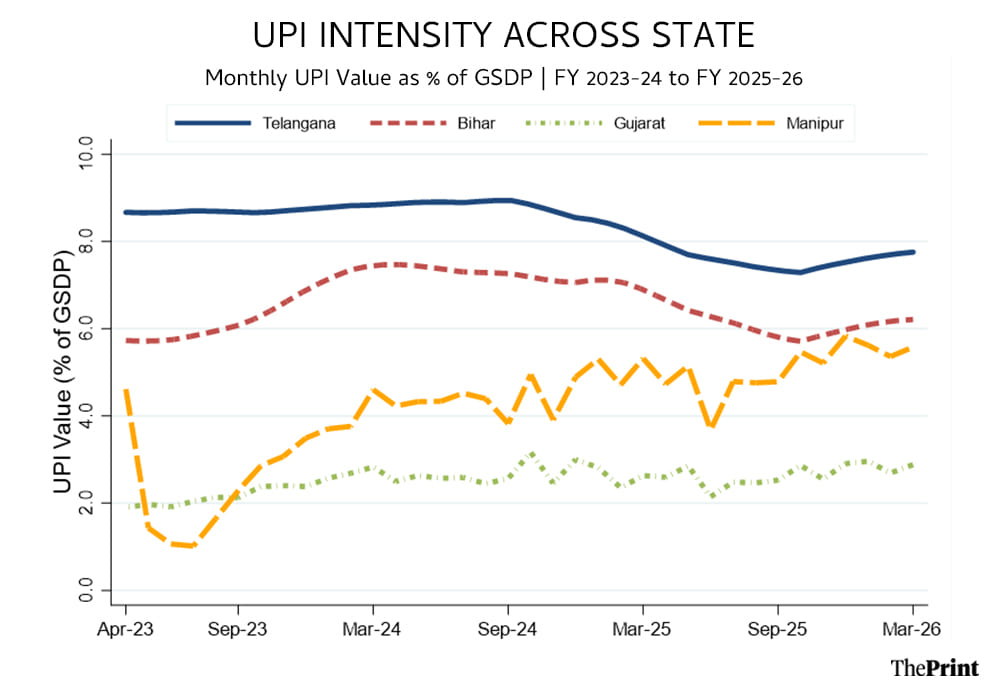
We normalise monthly UPI transaction value against GSDP over FY 2023-24 and FY 2024-25, and the curves tell us things no quarterly GDP estimate can.
Telangana sits at the top, consistently between 8.5 per cent and 9 per cent of GSDP per month. Telangana’s dominance reflects the convergence of several forces: rapid urbanisation, dense QR-code penetration, a services-heavy economy, strong smartphone adoption and Hyderabad’s emergence as one of India’s most digitally integrated urban centres. The consistency of the trend suggests that digital payments are no longer additive to the economy there; they are embedded within it.
Gujarat is the counterintuitive case. One of India’s three largest state economies flatlines at around 2.3 per cent to 3 per cent across both years, showing almost no growth. Gujarat, meanwhile, demonstrates why UPI intensity must be interpreted carefully. The state’s dominant trading communities (diamond merchants in Surat, textile wholesalers in Ahmedabad) operate through trust-based informal credit networks where cash remains the instrument of choice for large commercial settlements. UPI intensity appears to capture the density of consumer digitisation and transactional formalisation, not merely economic size.
Bihar is the most important line. Starting at around 5.8 per cent in mid-FY 2023-24, it rises to above 7 per cent by FY 2024-25: the steepest trajectory of any major state. Bihar’s GSDP did not grow fast enough to explain this; the movement is in the numerator, in UPI adoption genuinely deepening. Over the last few years, the spread of low-cost smartphones, cheap mobile data, Aadhaar-linked banking, direct benefit transfers and migration-driven remittance flows has fundamentally altered transaction behaviour in poorer states.
What was once overwhelmingly cash-based is increasingly moving onto formal digital rails. That shift carries enormous implications. Historically, poorer states were not merely income-deficient; they were data-deficient. Their economic activity remained difficult to observe in real time because so much of it occurred informally and in cash. UPI is beginning to change that asymmetry.
Also read: The rupee does not need a defender. It needs an economy worth defending
What policymakers should do with this
Three uses stand out. First, as an early warning system. When Manipur’s UPI intensity is examined, it crashes from 4.6 per cent in April 2023 to barely 1 per cent by July 2023: the ethnic conflict registered in transaction data within weeks, not quarters. No official indicator matched that timeliness.
Second, as a formalisation gauge. India’s informal sector still accounts for an estimated 45-50 per cent of total employment, with disproportionately low tax contribution. The gap between what a state produces and what flows through its digital payments infrastructure is a rough but honest proxy for how much commercial activity remains in cash. Gujarat’s flat curve, in a growing economy, quantifies that gap in running time.
Third, as a targeting instrument. The government’s Rs 1,500-crore incentive scheme for low-value BHIM-UPI transactions in FY 2024-25 is applied uniformly across states. State-level intensity data would allow far more precise targeting: directing merchant onboarding, digital literacy spending, and infrastructure investment toward Bihar’s rising curve, not Telangana’s flat one.
The caveats are real. The metric misses cash entirely. Share of “unclassified” transactions (UPI value with no state attribution) remains a transparency gap NPCI has not adequately addressed. These are reasons for methodological care, not inaction.
India has built, largely by accident, a real-time register of formal transactions that updates monthly, costs nothing to collect, and contains economic signals of genuine value. UPI data, properly used, measures where the economy actually is in the hands of 350 million users, across every state, every month. The question is whether India’s statistical establishment is treating it with the seriousness it deserves.
Payal Seth is the lead economist and Head of the Centre of Data for Economic Decision-making (CoDED) at Pahle India Foundation.
(Edited by Saptak Datta)