


Governance responsibilities are often split between politicians and bureaucrats, with the division varying across political regimes. In autocracies, appointed bureaucrats handle most (but not all) governance functions. In democracies, on the other hand, elected leaders usually set broad policy parameters, while bureaucrats implement policies and perform technocratic roles. Yet, significant variation remains. Empirical evidence that provides guidance on which tasks to assign to politicians and bureaucrats is limited and hard to come by because institutional changes that reallocate governance responsibilities tend to be large-scale, across-the-board reforms (Besley et al. 2022). For instance, democratisation and decentralisation tend to be nationwide, and are often bundled with other features such as change in polity size.
In theory, even in the short run, locally elected democratic leaders could spur development and improve citizen welfare. Elected leaders typically have better information on what citizens care most about (Martinez-Bravo et al. 2017, Liaqat 2020). Additionally, re-election incentives serve to keep elected leaders accountable (Ferejohn 1986, Myerson 1993, Finan and Mazzocco 2021). However, electoral incentives make local leaders (and all elected leaders, more broadly) susceptible to clientelism, and democratic systems, more broadly, to elite capture (Anderson et al. 2015, Bardhan and Mookherjee 2000, Besley et al. 2012). On the contrary, bureaucrats are accountable to higher administrators resulting in prioritising cross-jurisdiction spillovers (Myerson 2021). Lastly, the specific skill set of both bureaucrats and politicians differs – and may be differentially suited to different governance tasks (Bertrand et al. 2020).
The natural experiment
We test for these hypotheses by taking advantage of a ‘natural experiment’ in Karnataka (Arora et al. 2024). We focus on local governance as formalised by an elected Gram Panchayat (GP) council1. A GP leader is assigned an array of governance tasks: provision of local public goods, implementation of welfare programmes, and allocation of resources. For a variety of idiosyncratic historical reasons, GPs in Karnataka are on different electoral cycles to the rest of the country. Prior to 2020, these differences were immaterial: once a GP council completed its five-year term, fresh elections would soon be held to select a new council. In 2020, however, local elections were suspended due to the Covid-19 pandemic. The state government, following Karnataka law, appointed bureaucrats to govern GPs whose elected council had completed its term. These bureaucrats (called GP administrators) took charge in June 2020 and governed for about 9-10 months, until elections were held, and the new council took office in March-April 2021. This situation created variation in governance regimes between June 2020 to March 2021: ‘off-cycle’ GPs were governed by elected politicians while ‘on-cycle’ GPs were governed by appointed bureaucrats – giving us a compelling natural experiment. Using data from over 6,000 GPs we compare the quality of governance in politician- and bureaucrat-run villages along several important dimensions to shed light on the effects of local democracy and decentralisation.
Findings
Citizen preferences are better represented by politicians: To measure representation, we elicit citizens’ preferences over which categories of public goods the GP should spend on and use detailed administrative data to measure what policy priorities the GP funded during FY2020-21. We find that politician-run GPs are more likely to allocate funds in line with citizen preferences. In addition, we find that elected leaders engage more with citizens. Politician-run GPs hold more public meetings than bureaucrat-run villages – something propels elected leaders to consult more with citizens, and these interactions may help them learn more about citizen preferences.
Politician-run Gram Panchayats deliver social assistance more rapidly: In the second half of 2020, India emerged from a crippling nationwide lockdown that caused urban job losses, triggered reverse migration from cities to villages, and increased demand for rural social protection. The Mahatma Gandhi National Rural Employment Guarantee Act (MNREGA) was instrumental in providing relief during these months (Afridi et al. 2022)2. Local governments play a key role in delivering MNREGA benefits, by registering beneficiaries and organising public works projects. We show that politician-run GPs delivered more MNREGA social assistance between June and December 2020. Elected-governed GPs provided 83 days more person-days of work and registered 1.77 more new beneficiaries each month. By contrast, we see no difference in MNREGA delivery in prior years, when there was no difference in governance regimes.
How do politician-run GPs deliver social assistance more rapidly? We simply measure if GP staff show up to their office. We collect detailed attendance data for 170,683 local bureaucrats over a 108-week period during 2019-2021. Officers have a 12% higher attendance when politicians govern the GP. Thus, politicians push frontline government workers to exert greater effort, enabling local government to respond faster to citizens’ needs.
Politicians are more susceptible than bureaucrats to elite capture: As a proxy for elite capture, we measure whether GP spending is slanted towards the preferences of elites. We find that public spending is more strongly correlated with the preferences of traditionally powerful groups (men, upper castes, households in the GP’s main village) than those of disadvantaged groups (women, Scheduled Castes, households in peripheral villages).
For instance, in bureaucrat-run GPs, spending is 62% more strongly correlated with men’s preferences than women’s preferences. However, these representation gaps widen when politicians allocate spending. Expenditures become even more strongly correlated with the preferences of elite groups, with limited gains for disadvantaged groups. The gender representation gap widens from 62% in bureaucrat-run GPs to 71% in politician-run GPs, and we see similar patterns for caste (as in Figure 1). Even among powerful groups, spending in politician-run GPs only becomes more correlated with the preferences of citizens who live in the GP’s main village.
Figure 1. Percentage difference in GP-expenditure based on preferences of powerful groups
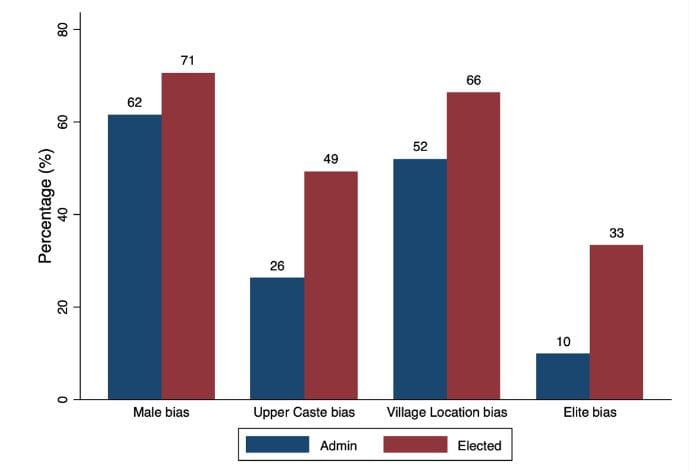
Thus, while elected leaders represent citizens’ preferences better on average (and no group is worse represented by politicians), the representation gains accrue primarily to socially advantaged citizens in the GP’s main village.
Bureaucrats can outperform politicians on governance tasks matched to their specific expertise: To understand how bureaucrats’ skills affect governance quality, we identify the (i) expertise of each GP administrator, and (ii) skills required by the universe of development projects ongoing in each GP. We define a bureaucrat’s expertise based on their job prior to becoming GP administrator. Administrators have varying expertise since they hail from a range of departments: rural development, education, water supply, fisheries, etc. Using detailed data on all 1.4 million development projects undertaken by every GP in Karnataka, we identify the type of project and measure the speed of project implementation using dates of project milestones. We find that, on average, projects managed by politicians and bureaucrats progress at a similar pace. However, when implementing projects in their domain of expertise, bureaucrats perform significantly better: projects are 57% more likely to show progress during a six-month window than similar projects managed by politicians.
Politicians and bureaucrats perform similarly in terms of internalising cross-jurisdiction spillovers: In many settings, politicians are elected from small jurisdictions within their polity and may value projects offering narrowly targeted benefits to their constituents at the expense of public goods. We measure how targeted each development project is by applying natural language processing techniques to project descriptions. We predict whether each project’s likely beneficiaries are particular households, a neighbourhood, or multiple localities in the GP. Based on this, we find no evidence that politician-run GPs make slower progress on projects that provide diffused benefits to a wide section of the GP.
Politicians and bureaucrats perform similarly on crisis management: Since our natural experiment took place during the pandemic, we compare performance on Covid-19 management. We find that politician- and bureaucrat-run GPs have similar pandemic-related outcomes over the study period: households have similar levels of Covid-19 mortality, morbidity and self-reported economic well-being, and citizens have similar evaluations of their GP’s quality of Covid-19 management.
Politicians and bureaucrats deliver similar local economic growth: We use satellite-based measures of both these outcomes – night lights to proxy growth and ‘Normalised Difference Vegetation Index’ (NDVI) to proxy agricultural productivity. We find no difference in growth in night lights and agricultural output between the two regimes. While this suggests that politicians and bureaucrats deliver similar local economic growth, it is very possible that our natural experiment is too short (only 9-10 months) to observe changes in aggregate outcomes.
Conclusion: Task-level decentralisation
These results indicate that politicians outperform bureaucrats in citizen representation and responsiveness. On the other hand, bureaucrats are less vulnerable to elite capture and outperform politicians on specialised tasks aligned with their expertise. Bureaucrats and politicians perform similarly on internalising externalities, crisis management, and delivering local economic growth.
Our findings broadly support efforts to decentralise political power to local levels of government. However, they highlight the difference between political and administrative decentralisation. Instead of viewing decentralisation as a binary ‘yes or no’ choice, policymakers could consider task-level decentralisation. Politicians could manage tasks where the binding constraint is local information or lack of effort, while technocrats could handle tasks that require domain expertise. Designing institutions so that politicians and technocrats manage tasks where they have a comparative advantage may improve governance and restore trust. In practice, however, tasks are often misallocated within government, as politicians opt to control specialised tasks (for example, monetary policy) for electoral gain, while centralised bureaucrats’ scepticism about politicians pushes them to resist devolution to local elected leaders.
Notes:
- India has a rich tradition of local self-governance and Karnataka is one of the first states to formalise the mandate of these local bodies in the 1980s. Here, we focus on village governments (Gram Panchayat), which constitute the lowest tier under the Panchayat Raj Institutions (PRIs) as created by the enactment of the 73rd Amendment to the Indian Constitution.
- We observe that demand for MNREGA work was twice as high in 2020 as in the same calendar months in previous years.
- We construct the representation gap by calculating the percentage difference in GP-expenditure on a category of public goods when a traditionally powerful group prefers it versus a disadvantaged group. For instance, if all men value spending on a particular category, bureaucrat-run GPs spend 5.4% more on it. By contrast, if all women think a category is important, GP spending is only 2.1% higher, implying that men’s preferences receive 62% more weight than women’s preferences.
This article was originally published on the Ideas for India website.
Thats not democratic