


Poor infrastructure and limited transport services constrain the mobility of both men and women, but women often face additional socio-cultural constraints that exacerbate these negative effects. Women’s labour force participation rates in urban India are among the lowest in the world. Poor transport infrastructure—in particular, lack of affordable, accessible, and safe public transit—may limit women’s access to jobs. It may also reduce female labour force participation by making it difficult for women to combine work- and family-related travel.
Until recently, transport planning and design were regarded as gender neutral that is, they were assumed to benefit men and women equally. There is now increasing recognition that women experience mobility differently from men. This paper examines how the mobility patterns of men and women differ from each other, and how they have evolved over time in Mumbai and whether lack of access to mass transit limits women’s access to jobs.
It is based on a survey of 3,024 randomly sampled households in the Greater Mumbai Region (GMR) in January–March 2019. The survey asked a man and a woman in each household about their labour market experience, their commuting behaviour, and their perceptions of the accessibility of public transit in Mumbai. Respondents who were not working were asked about barriers to employment. Each respondent also filled out a travel diary describing trips made during a 24-hour period.
Also read: In India’s job market, women have higher exit rate, lower entry rate than men: Study
Household travel patterns
Gender differences in purpose of trips
Eighty percent of men’s trips were work related, whereas only 17 percent of women’s trips were. Forty-one percent of women’s trips involved shopping, and another 9 percent involve taking children to or from school /tuition centres. In contrast, less than 7 percent of men’s trips were for these purposes. Twenty-two percent of women’s trips were for outings, socialising, or visiting relatives, whereas only 9 percent of men’s trips were.
For non-work trips, three results stand out:
- For both men and women, walking is the predominant mode of travel.
- Rail and bus are seldom used for non-work trips.
- Women generally travel by slower modes than men.
- More than two-thirds of all non-work trips were made on foot, and the percentage was higher for women (84 percent) than men (66 percent).
Gender differences in commuting to work
Women were 10 percentage points more likely than men to walk to work (38 percent versus 28 percent) and that they had larger modal shares than men for rail (20 percent versus 17 percent), bus (12 percent versus 8 percent), and auto rickshaw (14 percent versus 8 percent). Thirty-two percent of commute trips by men but just 9 percent of trips by women were by two-wheeler. The greater reliance of women commuters on walking and public transit mirrors patterns observed in other countries, as does the larger share for auto-rickshaws than two-wheelers.
A larger percentage of men commuted by faster modes (37 percent of men commuted by car or two-wheeler, in contrast to 12 percent of women). Sixty percent of women and 61 percent of men had commute times of 20 minutes or less, and 85 percent of women and men had commutes of 40 minutes or less.
Analysis of the data from the 2004 survey (tables 1 and 2) allows us to compare commute mode choice and commuting times by gender in 2004 and 2019. The stylised facts characterising commuting patterns in 2019—that a higher percentage of women than men walked to work and that a smaller percentage of women traveled by two-wheeler or car than men—also characterise commuting patterns in 2004. The big difference between the two surveys is the reduction in the share of people walking to work, the reduction in the share of men and women taking public transit, and the huge increase in two-wheelers as a commute mode. The share of men using bus (rail) as their primary commute mode fell by 50 (28) percent between 2004 and 2019, and the modal share of two-wheelers increased by 350 percent. Share of women taking bus or rail also fell but by a much smaller amount.
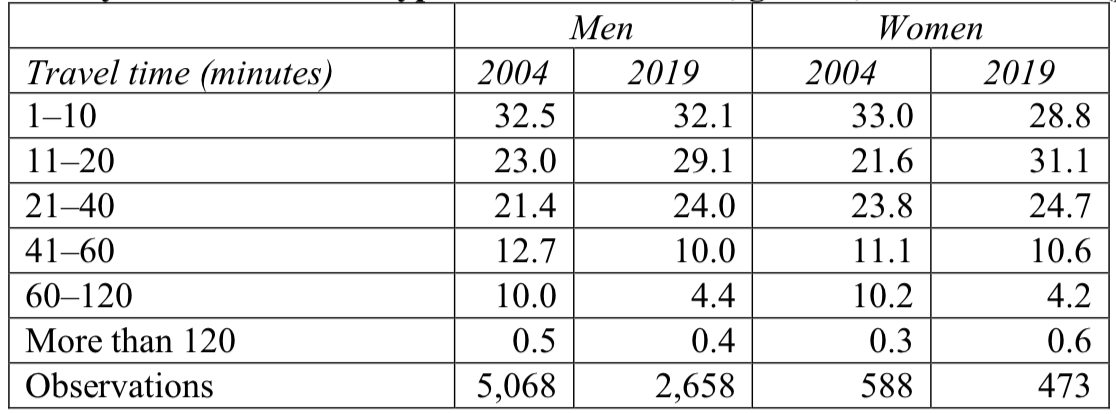
There was little change in the distribution of commute times: For both men and women, 55 percent of commutes in 2004 were 20 minutes or less, although the longer tail of the commute distribution observed in 2004 (10 percent of commutes of 60 minutes or more) was cut in half in 2019. The 2008 Comprehensive Transportation Study (CTS) report noted that informal employment was growing more rapidly than formal employment sectors in Mumbai. This increase in employment in informal sectors reduced the distance and consequently time taken to get to work.
Table 1 Main commute mode for typical commute to work, by gender, 2004 and 2019 (percent)

Table 9 One-way travel time for a typical work commute, gender, 2004 and 2019 (percent)
Also read: Despite wage increase, number of working women in India fell between 1983 & 2011, says study
A ‘Pink Tax’ on female mobility
The differences and the evolution of these patterns described above point to an implicit “pink tax” on female mobility. Between 2004 and 2019, there was a fall in satisfaction with bus and rail transit. Meaning that mass transit within the GMR appears not to have kept pace with the needs and expectations of the population. This may explain the increased use of two-wheelers and auto-rickshaws by both men and women.
However, adoption of private, and arguably faster, modes of transport has been slower for women. Furthermore, men have shifted largely to commuting to work by two-wheelers, and women shifted to using auto-rickshaws or taxis, which tend to be more expensive. Thus, there appears to be a surcharge or “pink tax” on women’s mobility.
Role of transportation in women’s employment decisions
Transportation and current employment
The results show that women are more likely to work the higher their level of education and the larger their household size. The impact of a woman’s age on the probability of working is U-shaped, decreasing until age 36 and rising thereafter. Having children reduced the probability of working, as does a husband having a monthly income of more than Rs 25,000. Furthermore, having to walk 20 minutes or more to the nearest rail stop reduced the probability that a woman worked outside the home by 4.5 percentage points, suggesting that access to public transit may play a role in explaining whether a woman accepts employment outside the home.
Transportation and willingness to work
Only 2.4 percent of women who were not working at the time of the survey reported having previously worked outside the home, although 26 percent had worked from home at some time in the past. The main reason given for not working outside the home was “domestic duties” (74 percent of respondents) and “own preferences” (20 percent). Only 3.4 percent of respondents cited jobs being too far from home.
When asked about barriers to working outside the home, 69 percent of women said that commuting was not a barrier. A small percentage of women said “public transit stops are far” (3.7 percent); that “trips are long” (3.9 percent); that “commuting is expensive” (1.1 percent); or that “commuting is unsafe” (1.6 percent). In contrast, 20 percent of women said that “childcare responsibilities” were a barrier to working outside the home.
When non-working women were asked if they would accept work, 11.4 percent said yes. Twenty-eight percent of these women would like to work from home, while the remainder were willing to commute. Seventy-four percent of women would prefer part-time, rather than full-time work. Only 2 percent of the 2,388 respondents were willing to accept regular, full-time work outside the home. These responses reinforce the notion that demand-side factors may be preventing some women from working.
The lack of suitable transport options is preventing some women from joining the work force. Female respondents who mentioned that commuting trips were long, expensive, and unsafe were more likely than other respondents to say that they would be willing to accept work. This implies that improving the transport network would increase female labor force participation. Women who reported that they would need to find childcare if they worked were less likely than other women to say that they would accept work. Women whose husband’s monthly income exceeded Rs 25,000 were also less likely to say that they would accept work. These findings suggest that factors other than transport determine women’s stated desire to work.
Also read: Don’t just blame patriarchy for fewer women in India’s job force. Blame our cities too
Conclusions
A transportation system that does not explicitly recognise gender differences in usage can exacerbate gender inequalities and limit women’s access to economic opportunities. In contrast, a transportation system that allows women to combine household responsibilities with economic activity, can enhance women’s likelihood of participating in the labour force. Policy measures focussed on improving public transit and walkability in Mumbai and provision of daycare facilities at key locations could differentially benefit women. Notably:
- Enhancing the walkability of Mumbai city by creating a walking friendly street network and providing affordable micro-mobility solutions in Mumbai (like scooters and bicycles).
- Improving the reliability, convenience, safety and frequency of bus and rail services.
- Taking a network approach to the routing and timing of the rail and bus systems and flexible tariff structures to better integrate public transit options and make public transit a more attractive option.
- Providing safe and affordable childcare services at suitable locations in Mumbai (possibly at or close to rail stations).
Several additional questions could be investigated using the survey data. A first step could link data on the time and cost of different modes to each commuter in the survey and to estimate models of vehicle ownership and mode choice. Doing so would help assess the impact of policies that shift commuters from private to public transit modes. It would also help estimate the impact of congestion taxes, which are gaining traction.
The survey data could also be used to estimate models of residential location choice, which could be used to value access to jobs, via rail and via private motorised transport. They could also be used to estimate the importance of access to jobs by men versus women in a household. Estimating such models would require data on employment by industry (available from the Sixth Economic Census) and occupation. The data could also be used to explore changes in mobility patterns based on changes in the transport landscape of Mumbai between 2004 and 2019.
To improve women’s agency, it is also important to understand travel behaviour for non-work-related trips. Models of mode choice quantify the trade-offs that women make between travel time, the monetary cost of travel, and mode characteristics (perceived safety, crowding, reliability). They yield information on the price elasticity of demand for various modes and quantify the importance of qualitative characteristics on travel choices. Estimates of accessibility from mode choice models serve as inputs into models that describe the number of trips taken. These models could be used to predict the impact of reduced bus fares for women, as suggested by the World Bank’s Gender Assessment of Mumbai’s Public Transport (2011).
Many of the results of this study point to inefficiencies in use of land in Mumbai. The data could be used, in conjunction with secondary data sources, to develop spatial equilibrium models that first quantify the level of land misallocation in Mumbai and then estimate the economic benefit of implementing counterfactual policies focused on improving land use in Mumbai.
Muneeza Mehmood Alam is an Economist in the Transport Global Practice of the World Bank.
Maureen Cropper is a professor of economics at the University of Maryland.
Matías Herrera Dappe is a Senior Economist in the Transport Global Practice of the World Bank.
Palak Suri is PhD student of economics at University of Maryland.
This is an edited excerpt from the authors’ paper ‘Closing the Gap: Gender, Transport, and Employment in Mumbai’, first published by The World Bank Group. Read the full paper here.
Wrong concept of Pink tax, I hope the author understands what actually is pink tax.
Women are not discriminated, what women choose does not count for the ‘tax’