


Timely statistics on employment and unemployment are key inputs in the process of designing appropriate policy interventions. While there are multiple sources of employment data in India, they come with a significant lag and capture different aspects. Inferring a consistent picture of the state of employment is, therefore, a challenge.
Data sources
Typically, in India, data on employment is sourced from household and establishment surveys. The quinquennial household surveys on employment conducted by the National Sample Survey Office used to be the primary source of labour market indicators till 2011-12.
Establishment surveys compile data on employment from establishments. Some of these include the Annual Survey of Industries, the Economic Census and the NSO’s survey on unincorporated non-agricultural enterprises (excluding construction).
Much of this data used to come with a considerable lag, making it unsuitable for gauging employment levels.
Based on the recommendations of a NITI Aayog Task Force, NSSO’s quinquennial employment surveys were replaced by the Periodic Labour Force Survey (PLFS). PLFS provides estimates of labour force, employment and unemployment on an annual basis for urban and rural areas. Additionally, for the urban population, quarterly estimates on key indicators of employment are reported.
In addition to the official surveys, the Consumer Pyramids Household Surveys (CPHS) conducted by the private agency, Centre for Monitoring Indian Economy (CMIE), are high-frequency surveys, and have come to be used widely to assess the economic status of households, including unemployment and incomes of households.
Comparability between PLFS and CMIE-CPHS
Currently, the two keenly watched sources of employment data are NSO’s PLFS and CMIE’s CPHS. The two data sources differ in terms of their definitions of households, reference period and sampling methodologies.
CPHS estimates the unemployment rate, based on the status of employment, as on the date of the survey or on the preceding day. In PLFS, estimation of employment at a quarterly frequency is based on Current Weekly Status (CWS). A person is counted as employed, if he or she has worked for at least 1 hour on any day during the preceding seven days of the date of survey.
In the annual PLFS, three types of estimates of employed and the unemployed are reported. These are the Usual Status, Current Weekly Status and Current Daily Status. For Usual Status, the reference period is 365 days. In the annual reports of the PLFS, employment status is reported with a reference period of one year (Usual Status) as well as one week (CWS).
Amongst other differences is the definition of households in the two sources. In the CPHS, the sampling unit is a house. The sampling is designed to create a fixed panel of houses for repeated surveys. In NSSO and other official surveys, a household refers to a group of people, who normally live together and eat their meals together.
Also Read: Surge in lending not alarming yet, but India needs to start watching out for excessive credit growth
Differences in employment estimates
The unemployment rate tracked by the CMIE does not match the picture captured by the PLFS. There are divergences in unemployment and labour force participation rates over the period, for which data is available from both surveys.
The table shows the divergence in the labour force participation rate, using CMIE and PLFS database. While the PLFS data shows broadly a consistent improvement in the urban labour force participation rate, the same cannot be inferred from the CMIE dataset.
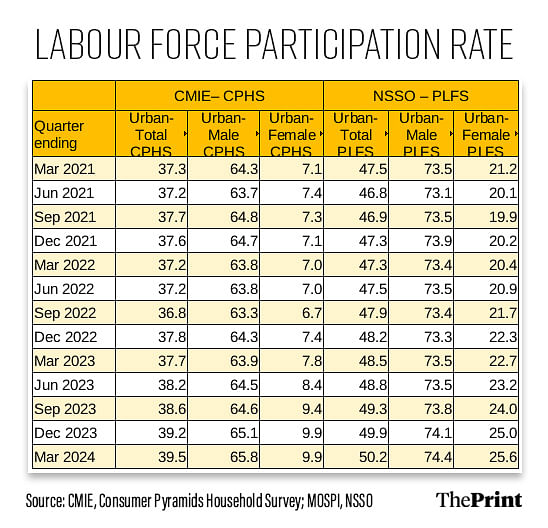
More striking is the difference in female labour force participation rate, as the magnitude differs widely in the two data sources. For the March quarter, it is 25.6, according to the PLFS, whereas the CMIE-CPHS estimates the figure to be less than 10 percent.
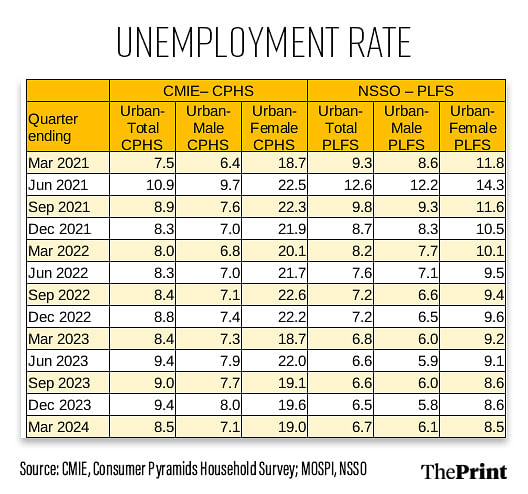
The unemployment rate estimates reported in the two datasets also vary. PLFS shows a decline in the urban unemployment rate after peaking in June 2021, though the numbers for the latest quarter show an uptick in the unemployment rate.
CMIE’s estimates, however, do not support the optimism seen in the PLFS data. Again, the main source of divergence lies in the female unemployment rate in the two datasets.
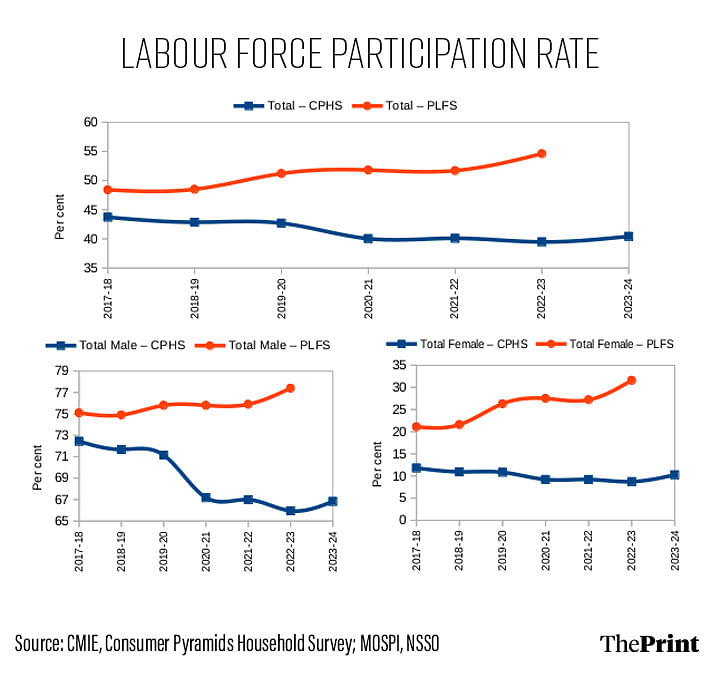
The annual estimates also present a contrasting picture of the state of employment. PLFS reports the employment statistics, using both the current weekly status and the usual status. For ease of comparison with the CMIE data, we compare the estimates reported in terms of current weekly status.
While CMIE estimates report a decline in the overall labour force participation rate, PLFS reflects an improvement from 2017-18 to 2023-24. For the Covid period, while CMIE reports a decline, PLFS shows an uptick. As far as the urban female labour force participation rate is concerned, CPHS shows a consistent decline till 2022-23.
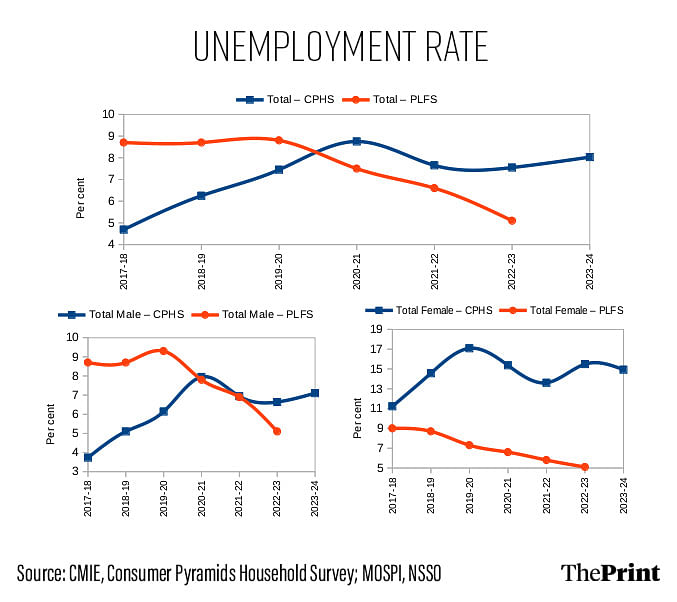
The unemployment rate is seen to be declining, when seen through the lens of the PLFS. The CMIE-CPHS estimates are less optimistic.
Categories of employed persons
While the headline numbers show an improvement, it is useful to look at the composition of the employed persons.
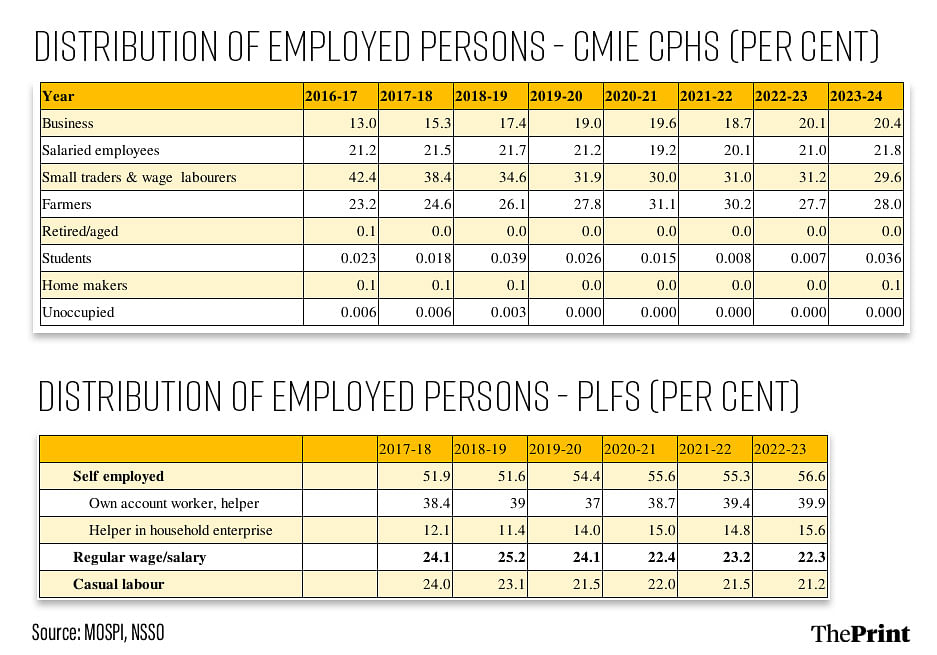
PLFS categorises workers in three broad categories — regular wage/salaried employee, self-employed, and casual labour. Self-employed category includes own account worker and employer, and unpaid helper in household enterprises.
The CMIE-CPHS has eight categories of employed persons — business, salaried employees, small traders and wage labourers, farmers, retired/aged, students, home-makers, and unoccupied.
Both sets of data show that there has not been a significant rise in the share of regular wage/salaried employees. PLFS reports a rise in the share of self-employed workers — mainly due to a rise in the share of helpers in household enterprises. 56 percent of the workers are self-employed, of which more than 15 percent are unpaid family workers.
Alternative approaches to estimate employment
In addition to surveys, there have been attempts to estimate employment using alternative approaches. A new report by the SKOCH group estimates that 5.14 crore person-years of employment have been generated on an average since 2014. The report has estimated employment generation from credit-linked schemes and government schemes.
The report says that on an average, a loan of Rs 85,000 helps in generating one credit linked employment. It also estimates employment generation through 12 government schemes. These findings, though based on assumptions, do provide a sense of the evolving pattern of employment in the country.
Radhika Pandey is associate professor and Rachna Sharma is a Fellow at National Institute of Public Finance and Policy, New Delhi. Views are personal.
Also Read: How poll-bound states are grappling with price rise, a factor likely to impact voter sentiment