Consumer Price Index (CPI) inflation eased marginally to 7 per cent in June from 7.04 per cent in May. It’s still above the upper tolerance limit of the Reserve Bank of India (6 per cent) for the sixth consecutive month. While edible oil prices showed a moderation, cereals and vegetable prices remained elevated. Duty cuts on petrol and diesel provided some relief, but services inflation is likely to remain elevated due to the reopening of the economy and the revival of demand.
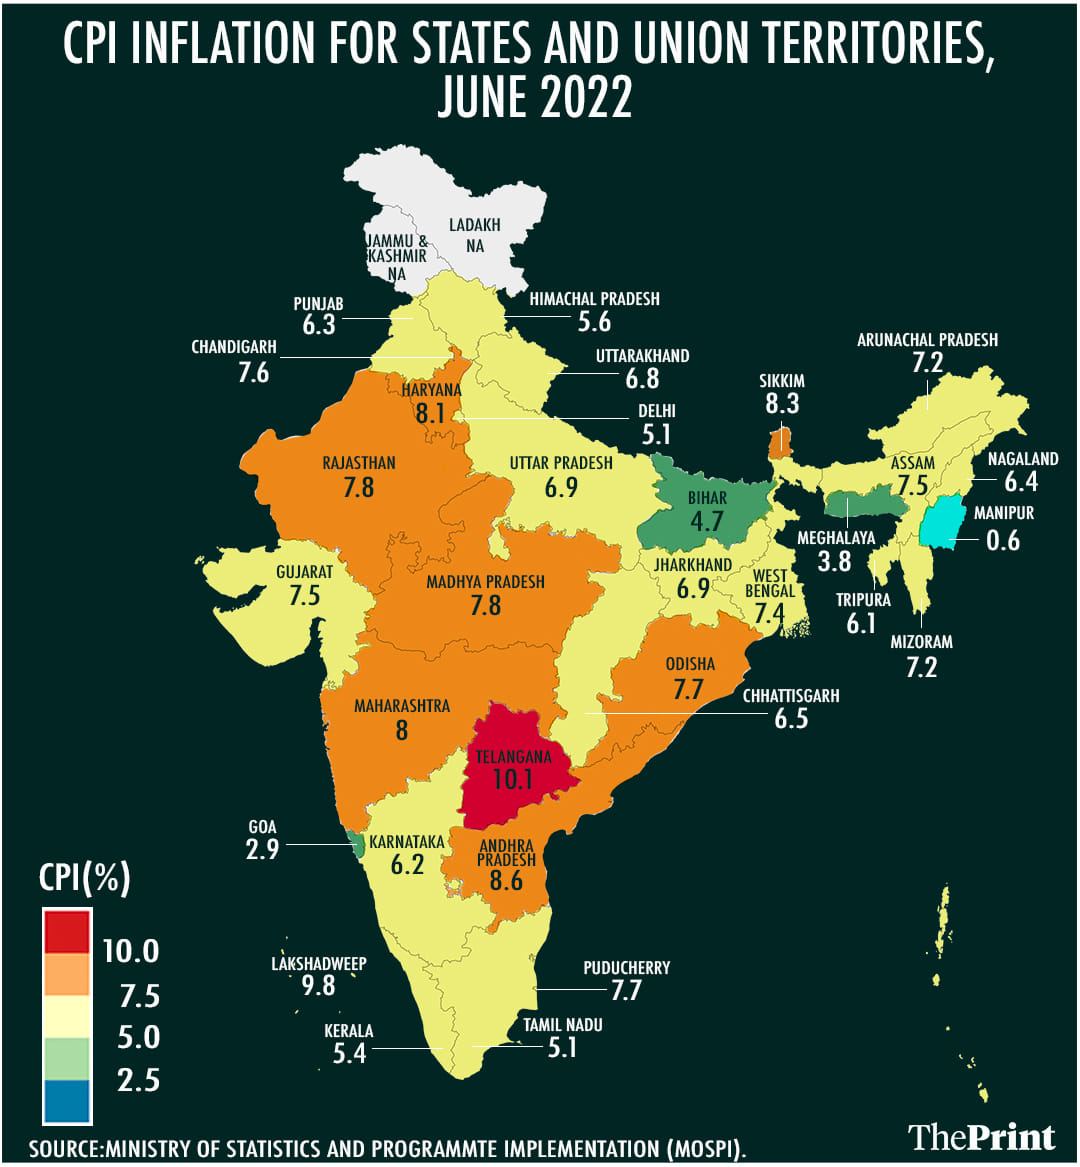
While the national inflation rate showed a moderation from May to June, among the states, Telangana clocked the highest inflation rate at more than 10 per cent in June, higher than the 9.45 per cent reported in May. Further, Telangana’s rural inflation is above the urban inflation.
Indicating possible supply-side bottlenecks, inflation is also seen to be elevated in states and Union Territories such as Jammu and Kashmir, Ladakh, Arunachal Pradesh, and Sikkim. In contrast, four states — Tamil Nadu, Kerala, Himachal Pradesh, and Delhi — had a little over 5 per cent inflation. Bihar reported the lowest inflation among all the large states (4.68 per cent). A combination of a rise in food prices and a build-up of core inflation pressures explain the rise in prices in states.
Also read: RBI’s forex focus is a good start. It must be followed by more fundamental reforms
Understanding state-level CPI
A key component of CPI is the consumption basket of households. The weights of the different items in the commodity baskets in state-level CPI are determined on the basis of the share of each item in the total consumption expenditure of households across the states.
These shares are obtained from the Consumer Expenditure Survey (CES), conducted by the National Sample Survey Organisation. The survey is designed to collect information on the consumption spending patterns of households across the country, both urban and rural. The weights for the current CPI series are based on the CES conducted in 2011-12, with a reference period of July 2011 to June 2012. This exercise is done for rural and urban regions of all states. The weights for CPI Urban and CPI Rural for each state are then determined based on the share of items in their consumption expenditure.
Reflecting differences in consumption patterns, there are wide variations in the weights of different commodities among states. For example, the weight of ‘food and beverages’ in rural Kerala is 44.07, while in rural Assam the share is 62.79. Weights also vary between rural and urban regions for each state.

Drivers of inflation in states
Inflation data for June shows wide variation among states and between rural and urban segments. For instance, in Assam, rural inflation exceeded urban inflation by more than 2 per cent, while in Bihar urban inflation exceeded rural inflation by more than 2 per cent.
In Telangana (the state with the highest inflation rate in June), the component that showed the steepest rise in prices in June was ‘fuel and light’. This component includes electricity, LPG, kerosene, coal, charcoal etc. The overall “fuel and light” inflation in Telangana was 21 per cent. Both rural and urban regions showed an increase in this category. However its weight in the overall CPI of Telangana is 6.1 per cent.
The key driver of inflation in Telangana is the “food and beverages” category. Food inflation recorded a growth of 11.6 per cent in June. The rise in prices was more pronounced in the rural segment. The weight of “food and beverages” in the overall CPI basket is more than 52 per cent for the rural areas. So, an increase in food prices in rural areas will reflect in higher overall inflation for the state.
Kerala’s inflation presents a contrasting picture. Inflation for the “food and beverages” category was 3.8 per cent in June. Food inflation in Kerala has remained below 5 per cent since November 2020. One of the reasons that have been cited for the relatively lower food inflation rate in Kerala has been its robust public distribution system (PDS). This has resulted in keeping the prices of essential items in check.
Tamil Nadu has also been able to keep prices in check, despite the weight of ‘food and beverages’ in its rural CPI being more than 52 per cent. One of the likely reasons is that the state provides a number of items through its PDS.
In Kerala, inflation has primarily been driven by the ‘miscellaneous’ category. There has been a consistent rise in inflation in this category since the second half of 2021. This category includes health, transport and communication, personal care, and other services. The increase in prices in this category indicates a revival of demand-side pressures with the decline in Covid cases.
In Haryana, while food inflation has seen a moderation in June, there has been a steep rise in the prices of clothing and footwear. The rise is seen in both rural and urban segments. Another component that has seen a sharp surge is the ‘miscellaneous’ category.
Resurgence of core inflation pressures
‘Clothing and footwear’ is one category that has seen a surge in prices across most states over the past few months, as a result of the opening up of the economy and the resurgence of pent-up demand. This, along with some personal care items and services (in the ‘miscellaneous’ category) have led to elevated core inflation.
Going forward, while lower food and commodity prices could lower inflation in states, the reopening of the service sector, the transmission of input costs, and the resurgence of pent-up demand could pose a challenge. The Reserve Bank of India is likely to continue with monetary tightening and raise the policy repo rate in next month’s monetary policy review.
Radhika Pandey is a consultant at National Institute of Public Finance and Policy.
Views are personal.
Also read: Freebies, bailouts, revival of pension scheme — why many states are at risk of fiscal stress


