


New Delhi: The Indian stock market is certainly overvalued, with multiple indicators pointing to this, and analysts warning of an “irrational exuberance” driving the surge in stock prices. The risk, they say, is of an unforeseen event causing a crash.
Such crashes — such as what happened due to COVID-19 in 2020, or the Russia-Ukraine war in 2022 — can be particularly bad if markets are overvalued in the first place, as they are now. This would mean lakhs of retail investors could lose a significant portion of their investments, since even stocks perceived to be ‘strong’ take years, if not decades, to recover.
The BSE Sensex, a benchmark stock exchange in India, crossed the 80,000-mark on 4 July, and has remained at that elevated level ever since. The market closed at 80,519 last Friday. The current market capitalisation of the Bombay Stock Exchange stands at Rs 450 lakh crore, as much as 16 percent higher than its level as recently as end-March 2024.
ThePrint has analysed a number of metrics that measure whether markets are overvalued, undervalued or fairly valued — including the Buffett indicator, the price-earnings ratio, and sectoral metrics of revenue and profitability — and has found that each one of them points to a significant overvaluation of the stock market.
Stock market analysts, too, confirm this, adding that it’s being driven by “fanciful narratives”, erroneous behaviour by retail investors who perceive the success of one company as being the success of the entire sector, and the “problematic” statements by ministers in the government predicting that markets will continue to rise.
The issue is particularly noticeable in small and mid-cap stocks, they add.
“The market is overvalued,” V.K. Vijayakumar, chief investment strategist at Geojit Financial Services, told ThePrint. “In large caps, the valuation is not excessive, although even those are higher than historical averages. But if you look at the mid and small caps, the valuations are almost in ‘frothy’ territory.”
Ajay Bodke, an independent market analyst, agreed with this assessment, adding that this overvaluation is being driven by “the irrational exuberance of current investors, led by fanciful narratives”.
Also read: Why is Modi govt afraid of its own successes? Banking, stock market, GST hold the answer
All signs point to a bubble
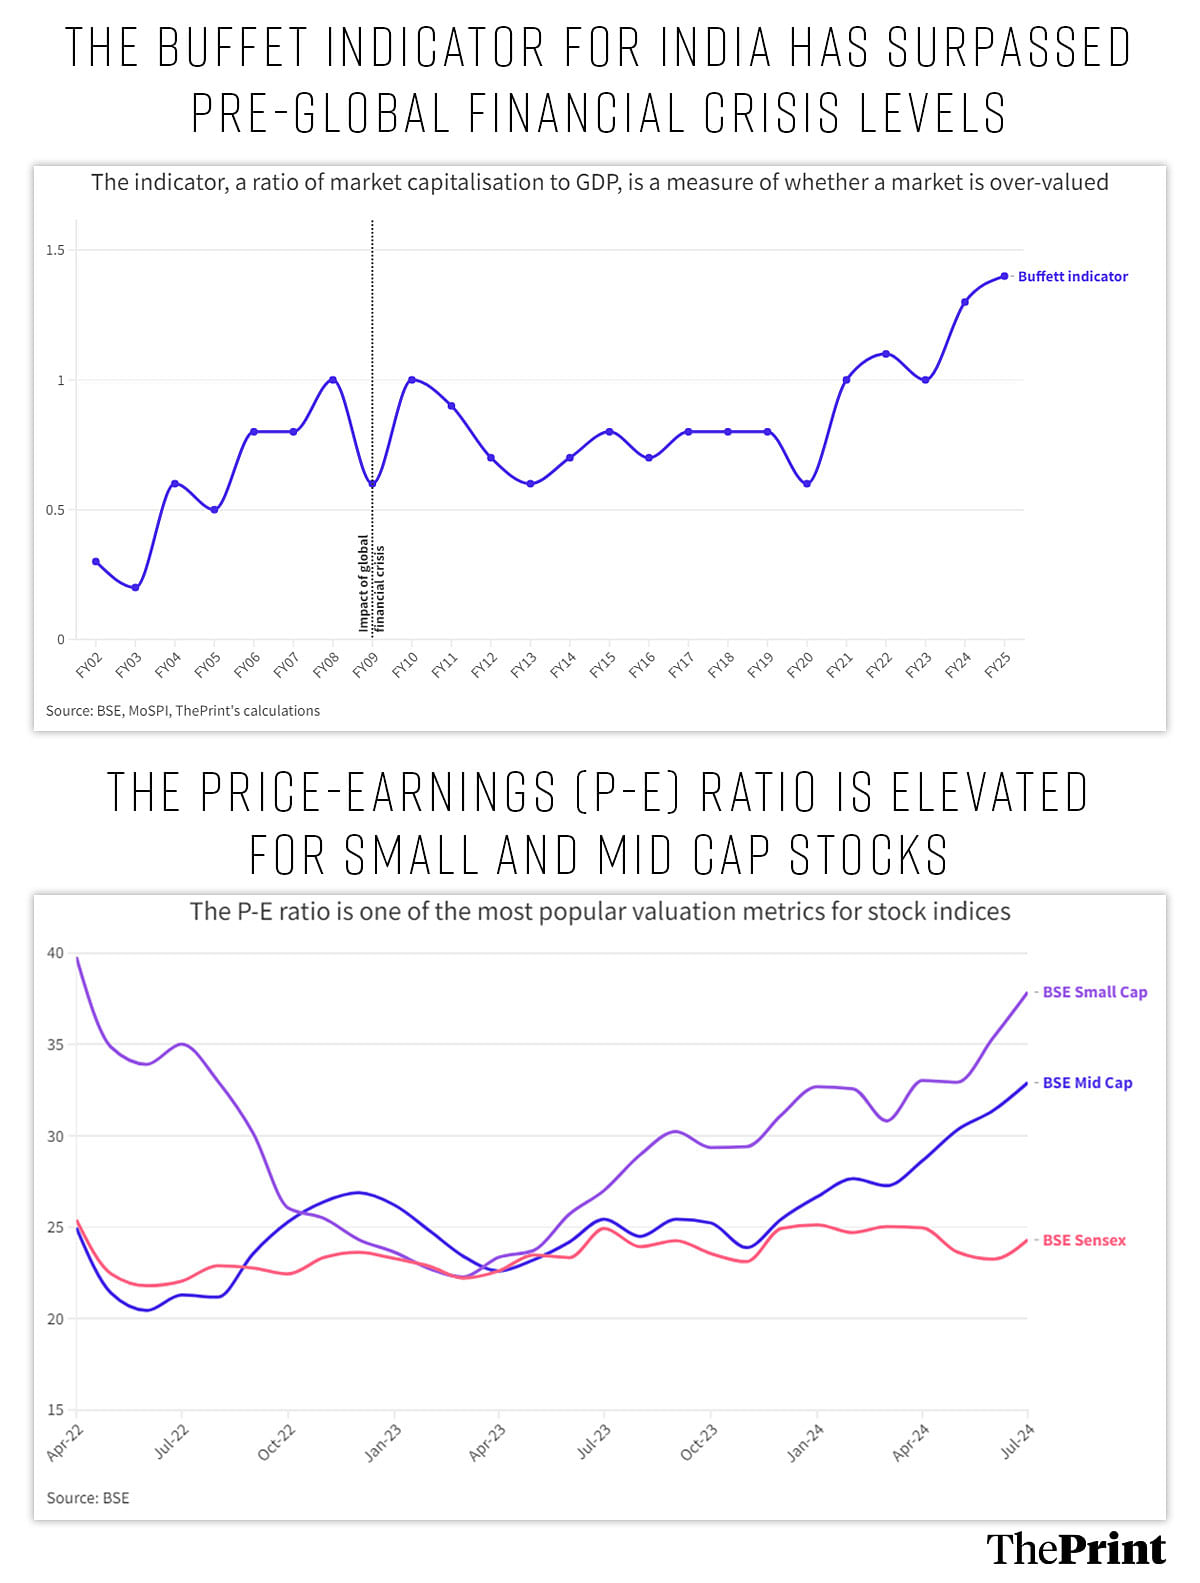
The Buffett indicator, devised by veteran investor Warren Buffett, is a measure of the valuation level of the stock market of a country as a ratio of its gross domestic product. In other words, it links the stock markets to the actual economic output of a country.
The data shows that India’s Buffett indicator value — at 1.4 — is far higher than its historical average, indicating that the market is significantly overvalued. In fact, the indicator is currently even higher than its level in the run-up to the Global Financial Crisis of 2008-09, which had put the brakes on a historic surge in global and Indian markets.
“If you take the historical value for the Buffett indicator, the historical average is 0.89, and currently the value is 1.4. It is indicating high overvaluations,” Vijayakumar said.
However, he did say that this high Buffett indicator value was not unique to India, and that it was at elevated levels in most international markets.
“Globally, we are seeing a bull market, and in a bull market, valuations after a time turn elevated,” he explained.
The other indicator that points to significant overvaluations, especially among small and mid-cap stocks, is the price-earnings (P-E) ratio. This is the ratio of the price of a particular stock or index to the earning per share (EPS) of that stock or in that index. The EPS is broadly the share of a company’s profit that is distributed to each share of stocks.
This ratio, thus, pegs the stock price or index level to the financial health of the underlying stock or index.
Analysts have told ThePrint that a P-E ratio of above 23 is when a stock or index can be considered overvalued, and investors are asked to sell some of their holdings. The P-E ratio for the overall Sensex is currently about 24.3, while it is even higher for the mid-cap and small-cap indices, at 32.9 and 37.9, respectively.
Market exuberance & narrative building
Bodke explained that, in many cases, the underlying business is strong and growing and has healthy order books, but the excessive valuations are based on earnings in the medium to long term that are unsustainable.
“A lot of this valuation growth is predicated on the irrational belief that there will be no cost or time overruns in the projects by these companies,” he said. “In India, anything that can get litigated, such as environment or forest clearances, for example, leads to huge delays. There are factors not in the control of the company that can lead to targets being missed.”
“But the market is assuming that the execution of these projects will be flawless,” Bodke added. “The stock market is the only asset class where demand goes up with an increase in the price of that asset.”
These two factors, he said, were examples of the irrationality of the markets.
The defence and railways sectors are two prime examples of stock valuations growing at rates far in excess of the growth in the underlying company fundamentals.
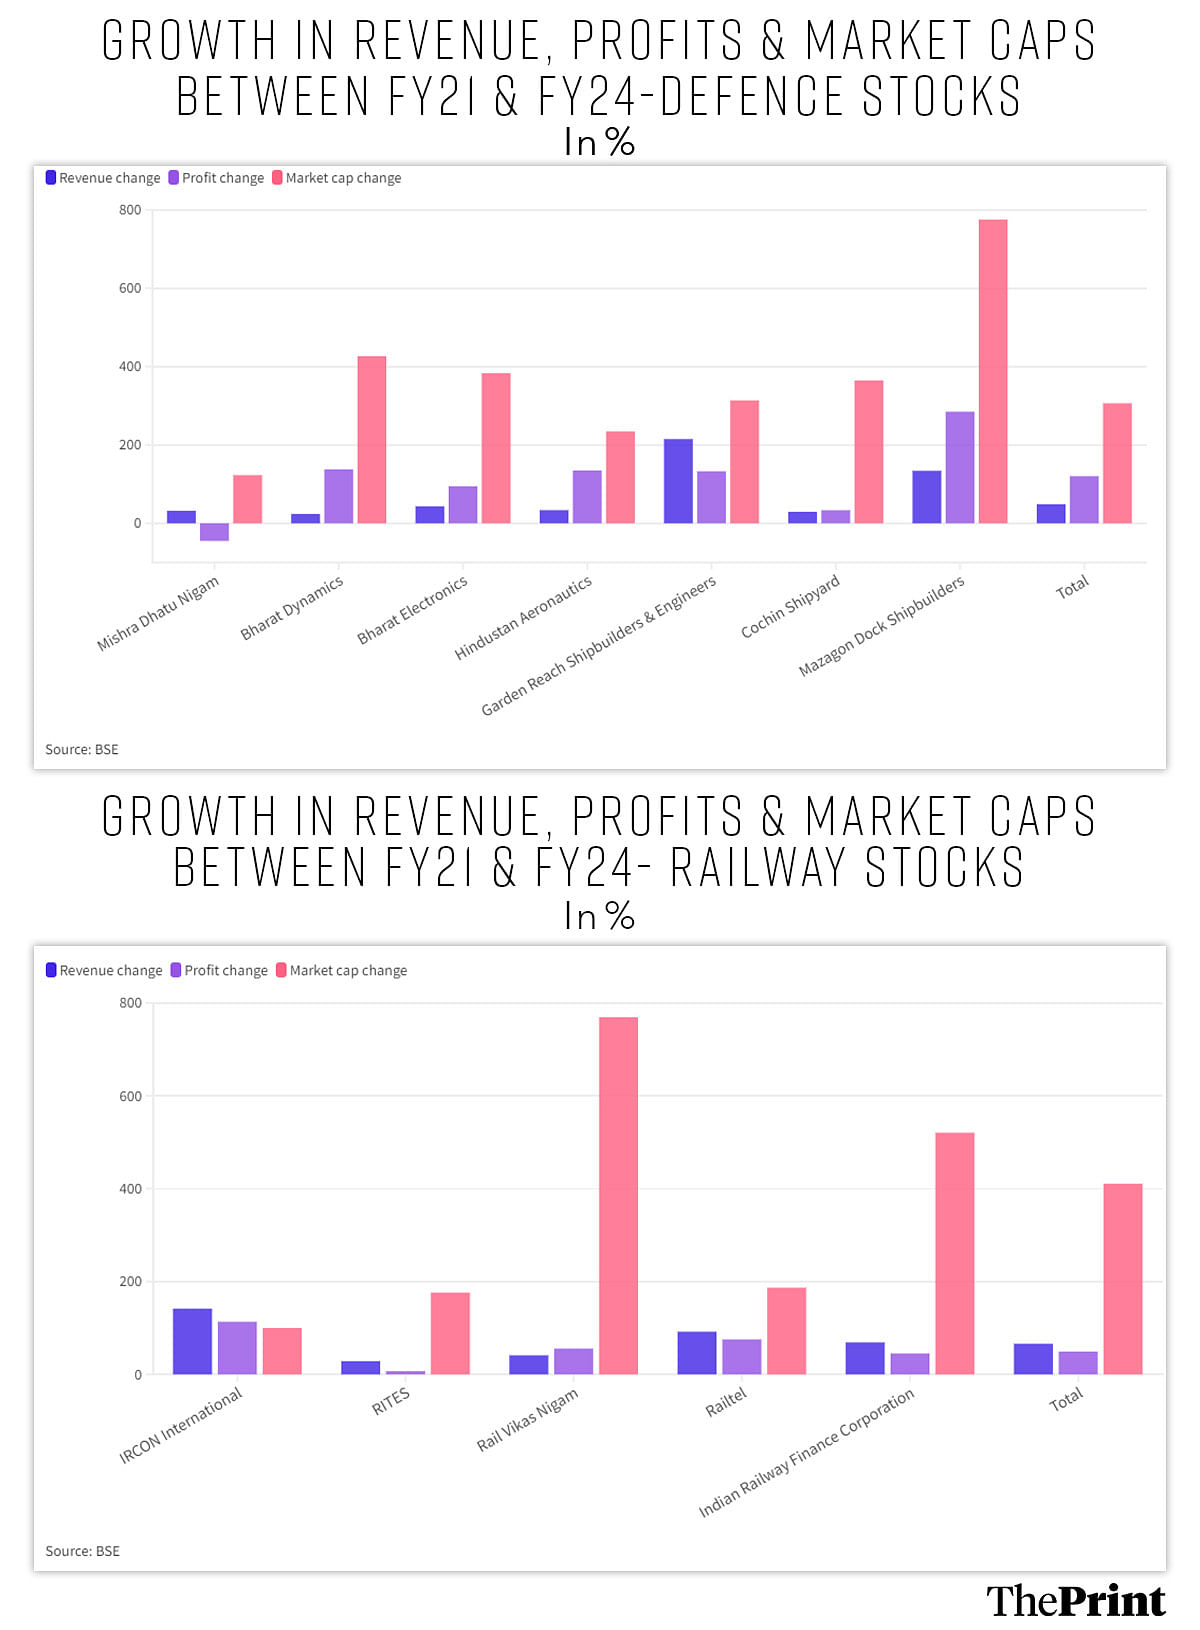
Between 2020-21 and 2023-24, the seven major defence stocks analysed by ThePrint saw their combined revenues grow by 49 percent and their profits by 120 percent. The market capitalisation of these companies, however, grew by 306 percent during this period.
Particular defence stocks further reinforce this finding. Mazagon Dock Shipbuilders, for example, saw a whopping 775 percent growth in its market capitalisation during this period, whereas its revenue and profit grew by a relatively much lower 134 percent and 285 percent over these three years.
The defence public sector undertaking Mishra Dhatu Nigam saw its profit contract over the 2020-21 to 2023-24 period, and yet its market capitalisation grew 123 percent.
In the railways stocks, this phenomenon is just as stark, if not more. For the five railways stocks analysed, combined revenues grew 66 percent and profits 49 percent, while the market capitalisation surged 411 percent.
Here, too, particular stocks serve to further emphasise this discrepancy. For the Indian Railways Finance Corporation (IRFC), revenues grew 69 percent and profits 45 percent, but its market capitalisation ballooned by more than 520 percent.
“The other factor is that the market is looking at winners, that is, companies that indeed have been able to execute on time and well, and is then erroneously extrapolating this to all the companies in that sector,” Bodke said.
Also read: 54 lakh informal jobs lost, stagnant worker output — how DeMo, GST & COVID hit India’s manufacturing
What happens when things turn sour?
“The concern I have is that big crashes in the market happen for previously unforeseen reasons,” Vijayakumar said. “Known factors will not cause big crashes.”
He explained that the COVID-19 pandemic and the Russian invasion of Ukraine were both unforeseen and led to significant corrections in the markets.
“The problem, really, is that unknown factors can cause very big corrections in the market when valuations are high or overvalued,” he noted.
A big fall in the market would lead to a significant erosion of investors’ wealth and savings, especially since financial sector indicators are currently pointing to the fact that households are increasingly choosing stock markets over banks to invest their money.
Here, again, the examples of a few stocks show the damage a bubble and an unforeseen crash can wreak. Wipro, Infosys and DLF have been among the leaders in their respective sectors — sectors that themselves have seen strong growth over the past 20 years — and are representative examples.
Their experience with stock market bubbles and crashes is indicative of what even strong stocks can suffer.
The early 2000s saw Wipro’s stock rise to as high as Rs 359 per share in February 2000, followed by a precipitous crash following the bursting of the ‘dotcom bubble’ and the exposure of various stock market scams in India. By May 2003, the stock was trading at about Rs 30 apiece. It took until October 2020 — or 20 years — to recover to the highs it had seen in 2000.
Infosys, similarly, saw its stock price rise to Rs 166 in April 2000, before crashing to Rs 34 by September 2001. It, however, recovered much quicker than Wipro, by November 2005.
The third example of a strong stock that took a beating during a crash and struggled to recover thereafter is DLF. The real estate giant’s stock price stood at nearly Rs 1,100 in December 2007 — months before the Global Financial Crisis really erupted — following which it crashed to Rs 151 by February 2009. It took the DLF stock all the way till February 2024 to reach Rs 900, and it’s still trading below its pre-GFC level.
This report has been updated to reflect corrections to the stock prices of Wipro and Infosys sourced from the Bombay Stock Exchange.
(Edited by Rohan Manoj)
Also read: Higher profits, lower debt, ‘Modi stocks’ effect — Adani market cap zooms past pre-Hindenburg levels
I know that Infosys stock has undergone multiple splits in between the dates mentioned in the stock’s timeline, so the information is incorrect.
Wipro and Infosys data described in the article is incorrect. Their share prices have never reached the levels you mentioned in the article. The highest Wipro reached was Rs 334 and for Infosys it was Rs 182.
Kindly verify.
Sir,
The price chart for Infosys and Wipro looks erroneous. Kindly, check the prices again
People who gamble their money must have awareness about the risks involved in such investments. It is not the job of government to either educate them or excessively protect them.