


If taken seriously, India’s Index of Industrial Production could give an incorrect impression about the state of affairs across industries to policy makers.
The November 2017 surge in the Index of Industrial Production (IIP) has given a new reason to cheer about the performance of the manufacturing sector. The general IIP Index saw a sharp rise of 8.4 per cent, whereas the IIP manufacturing Index growth jumped to 10.2 per cent in November 2017 over the previous year.
IIP growth rates continue to surprise us for a variety of reasons. While reasons for the surprise differ each time, decoding abnormally high (or low) growth rates remains a considerable challenge. The November 2017 surge has again posed this challenge. A 10 per cent growth rate of the manufacturing sector prompts more questions than answers. So what has resulted in the recent surge and what does this high growth rate tell us about the performance of the manufacturing sector?
The November press release makes an interesting reading about the performance of various industries that contribute to the IIP Index. Fifteen of 23 industries have shown a steep rise; with pharmaceuticals, computer & electronic products and the transport equipment industry showing a growth of nearly 39.5 per cent, 29.1 per cent and 22.6 per cent over the previous year.
Commentators and industry analysts have suggested various reasons: that the recent surge has a favourable base effect (since November. 2016 was an abnormal month due to demonetisation), re-building of inventories after the festive season, strong export growth, sharp pay-back from GST-related disruptions and recovery from the remaining ill-effects of demonetisation.
Some of the factors may indeed have contributed to the recovery process, but the magnitude of the surge remains to be decoded. First, rebuilding of inventories, exports and GST-driven problems requires a much deeper analysis across industries before their effect can be quantified on IIP growth rates.
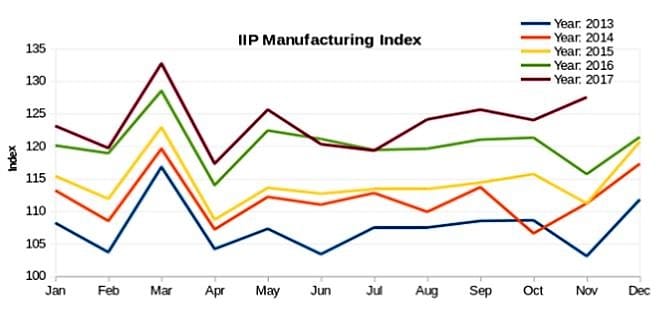
Second, the question of a favourable base effect can be dealt with. In Figure 1 we plot the month wise index of IIP manufacturing from 2013 to 2017.
The month-wise variation in the index shows a clear seasonal pattern, especially during March and November. Across all years, in the month of March we see an uptick. Compared to October, in three of the last four years, the index has shown a clear dip in November. The story this year is similar to 2014, where the index has risen in November, instead of taking a dip.
Base effects could have magnified growth rates in the past as well, which is why comparing growth rates without adjusting for this feature of the index can give an unrealistic picture. One option is to look at the month-on-month growth rates. But since there are seasonal patterns visible in the data, the logical approach is to de-seasonalise the index, and then compute the month-on-month growth rates.
In Figure 2 we plot the de-seasonalized month-on-month growth rates of the general and manufacturing index for the same period.
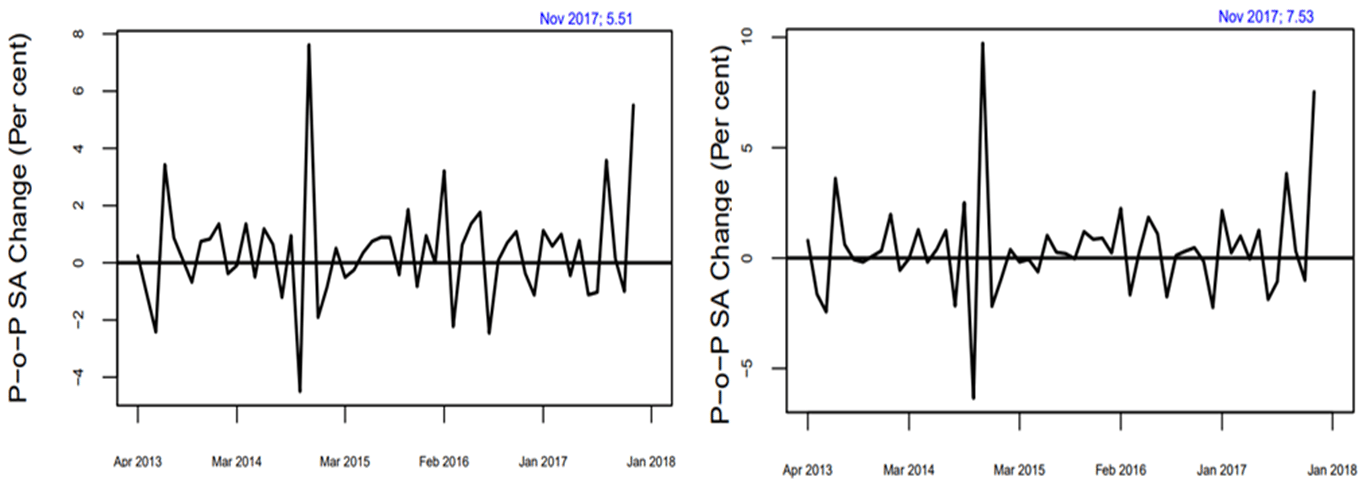
The month-on-month seasonally adjusted growth rate is seen to be to 5.5 per cent of the general index and 7.5 per cent on the manufacturing index. We now have a much clearer picture of the manufacturing sector as part of the surge due to seasonal variations, base effects, etc. has been decoded.
Technically, seasonal adjustment corrects for the systematic fluctuations that we commonly observe, such as change of seasons, festivals, period of tax filings, end of financial year or even monsoon. As some months have some peculiar reason for a sharp rise of a fall, they invariably distort the usual movement of the index. The point worth noting is that even after removing the base effect and seasonal variations we notice a surge in growth rate.
IIP as a performance indicator of the manufacturing sector is riddled with several complications. If taken seriously, the inadequacies can give an incorrect impression about the state of affairs across industries to policy makers and other stakeholders. The IIP is a critical input in framing estimates of the manufacturing-side GDP. Since it is budget season in February, GDP estimates will be required to deliberate on economic outlook and policy measures in the sector.
Having said that, it is also worthwhile to argue; that resolving the measurement issues of the index is an equal challenge, as is using the index for effective policy purposes.
Radhika Pandey, Amey Sapre and Pramod Sinha are at the National Institute of Public Finance and Policy (NIPFP), New Delhi.