






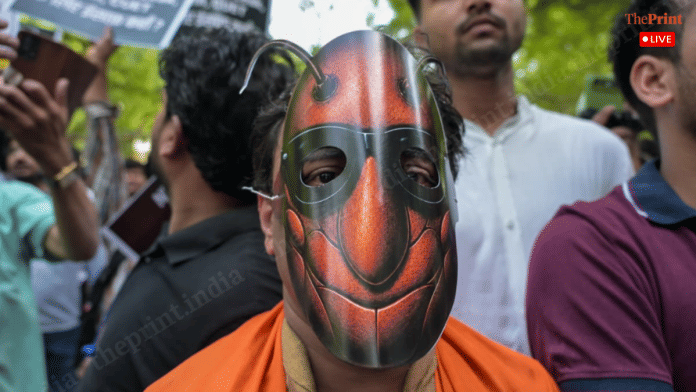


If you were online during the recently concluded Cockroach Janta Party-led protests, news coverage likely failed to match your experience on social media. I went looking for why, analysing 1,528 news articles and over 42,000 YouTube comments. I scored each one for tone using VADER, a standard, open-source sentiment-analysis tool. Then I checked the patterns against real attention and engagement data from YouTube API, Wikipedia pageview logs, and Google News search.
The search soon turned into four separate inquiries: who actually told the story, how people really felt about it, which moments truly mattered, and at what moment the story exploded.
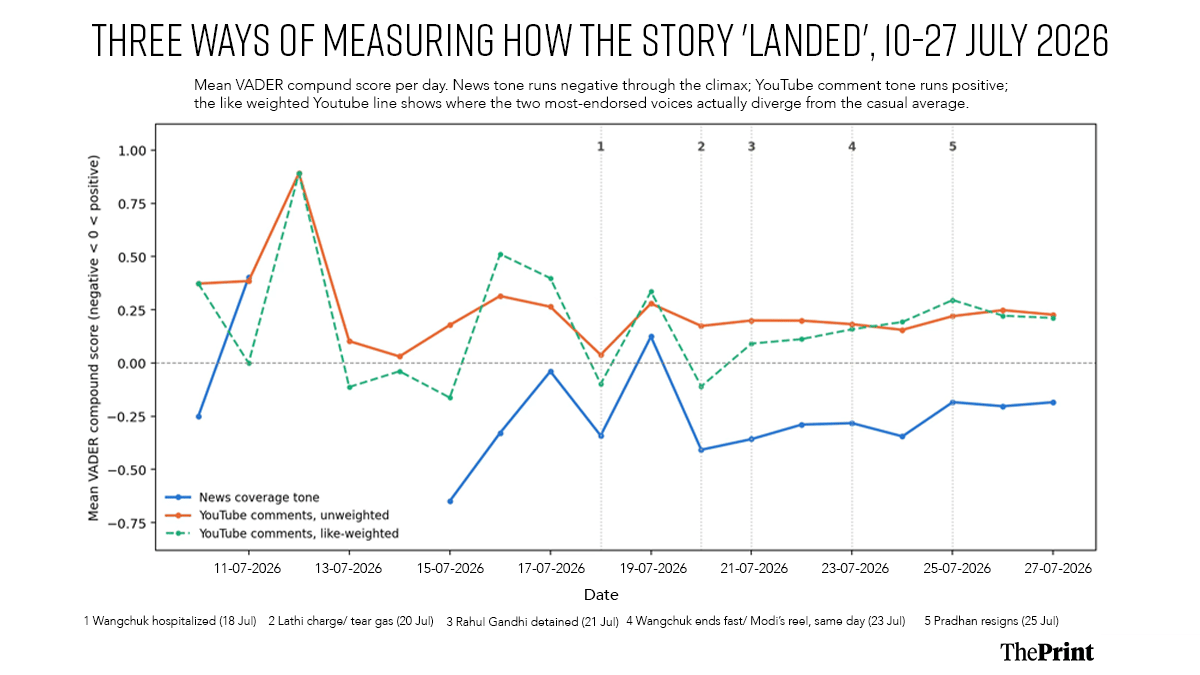
Let’s start with the mood since that is a mismatch many have already noticed. If you only read the news, you’d think the whole country was miserable for the entire 70 days between the CJP’s formation and Dharmendra Pradhan’s resignation. Real news coverage, scored day by day, stayed grim almost the entire second half of July, even on the day Pradhan resigned. But YouTube comments, scored the same way, stayed upbeat almost every single day from the moment the tear gas shelling started. The same 70 days, but two completely different moods.
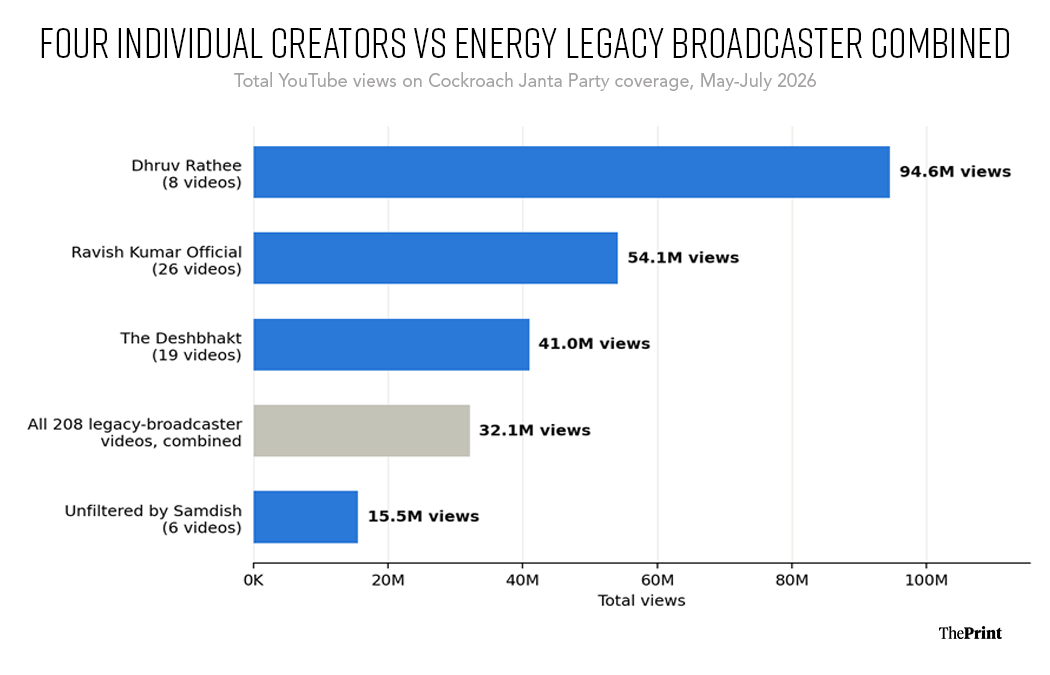
The gap only makes sense once you ask who was telling the story. On YouTube, four individual creators reached more people on this topic than every news broadcaster in the country combined. Dhruv Rathee posted eight videos, which amassed 94.5 million views. Ravish Kumar posted 26—almost a daily diary from the leak to the resignation—with 54 million views. Akash Banerjee ran a numbered series on his Deshbhakt channel: 14 parts, 41 million views. And Samdish Bhatia, at 15.5 million views, beat every single legacy news channel’s total. The four creators together got over 205 million views. Major broadcasters’ coverage of the story combined—including Times Now, NDTV, the BBC—added up to 32 million. One man with eight videos beat that number.
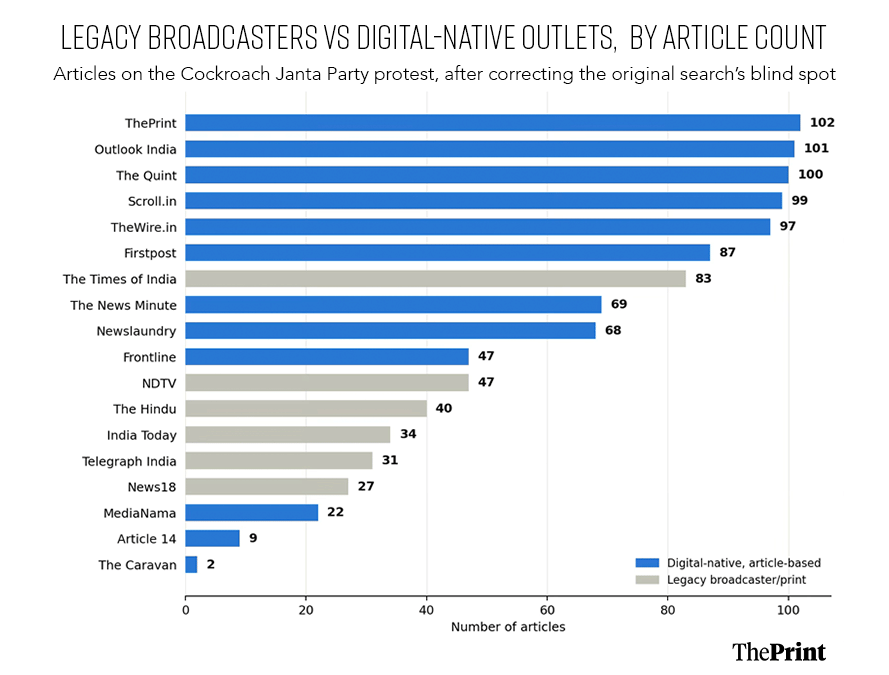
The same pattern was visible in the number of articles published by news websites, tracked here as a proxy for how much attention an outlet actually devoted to the story. While it isn’t a perfect measure of depth or quality, it’s a consistent, checkable one, applied the same way across every outlet. My first check made it look like the Times of India had covered the protests more than any other outlet, at 83 articles. Then I searched some more, and the whole ranking flipped. ThePrint had written 102 pieces, Outlook had 101 articles, The Quint published 100, Scroll had 99, The Wire had 97, and Firstpost, 87. Each of these platforms beat the Times of India. The outlets that actually sat down and thought about this story outworked the ones that just filed wire copy about it.
It must be noted that article count is a proxy for attention, not depth or reach: it does not capture article length, readership, or prominence on a homepage. It also undercounts legacy broadcasters specifically, since their primary format is television and not web articles—the same gap as the earlier video comparison. What it does reliably show is which outlets kept writing about the story, and on that narrower question, the digital-native outlets clearly did more. These are the platforms where Gen Z gets its news.
Also read: India has a military Vision 2047. Now it needs a system to deliver it
Who was writing about the CJP, and how much?
The mood gap starts to make sense once you see who was actually reaching most of the online audience with this story. It wasn’t the outlets a reader would assume were setting the tone.
But as we saw in the first chart, was the audience actually happier than the news? Is it a simplistic assertion, or does more hide behind it?
Not every comment counts the same: some get 10 likes, some get 50,000, and weighting them by that figure changes the story. The day of the lathi charge, 20 July, is the single sharpest mood swing in the entire dataset: the average comment that day was still upbeat, but the comments people actually liked the most were furious. People weren’t just posting; they were specifically rewarding anger. Four days later, on the day Pradhan resigned, the mood flipped: the most-liked comments ran the warmest. People were specifically rewarding relief. So the audience wasn’t just “positive”, it was precise.
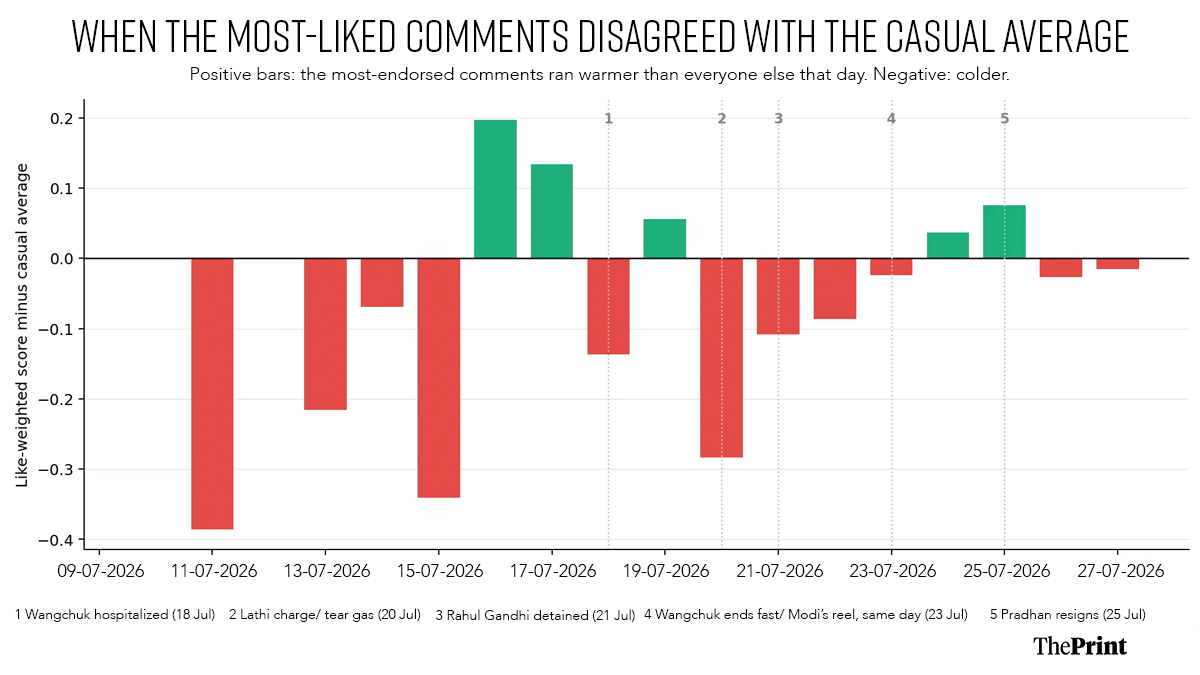
Three YouTube comments make the point better than any chart. “Education minister resign button” has close to 88,000 likes. “Shame on government” has over 50,000—a clear rebuke of the State. “Justice for Sonam Wangchuk sir” has over 47,000 likes. None of these comments sounds anything like a news anchor. They sound like people who were angry one week and relieved the next.
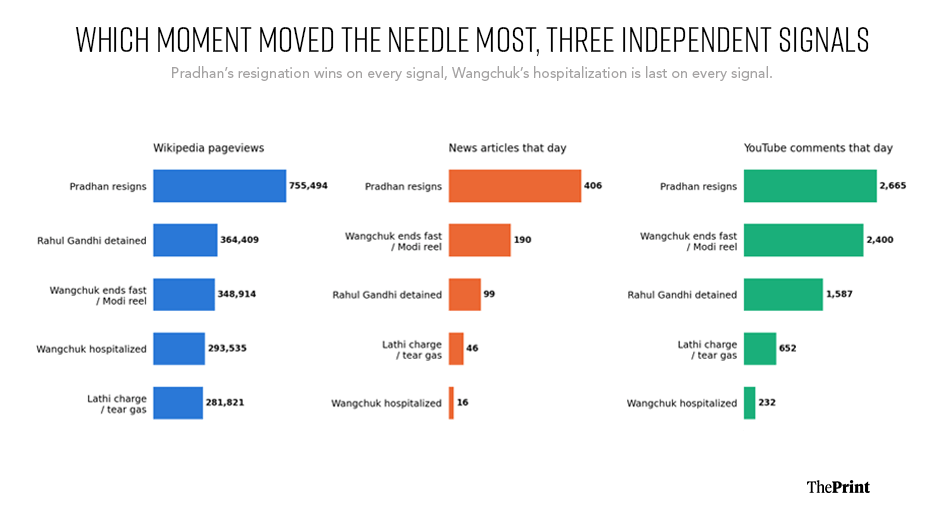
The audience’s precision shows up again when you rank the major moments from the movement. I ranked five big ones—Wangchuk being admitted to the hospital, the lathi charge, Rahul Gandhi getting detained outside the PM’s house, Wangchuk breaking his fast, and the resignation—against three totally separate signals—how many people looked it up on Wikipedia, how much news got written that day, and how many comments showed up on YouTube. All three run parallel. The resignation wins by a mile on every platform. And Wangchuk’s hospitalisation comes in last on all three, which sounds surprising until you realise that people had already been watching his health crash for two days. The public wasn’t shocked when it happened.
Also read: The new Vande Mataram Bill revives a debate India settled decades ago
Why the CJP exploded when it did
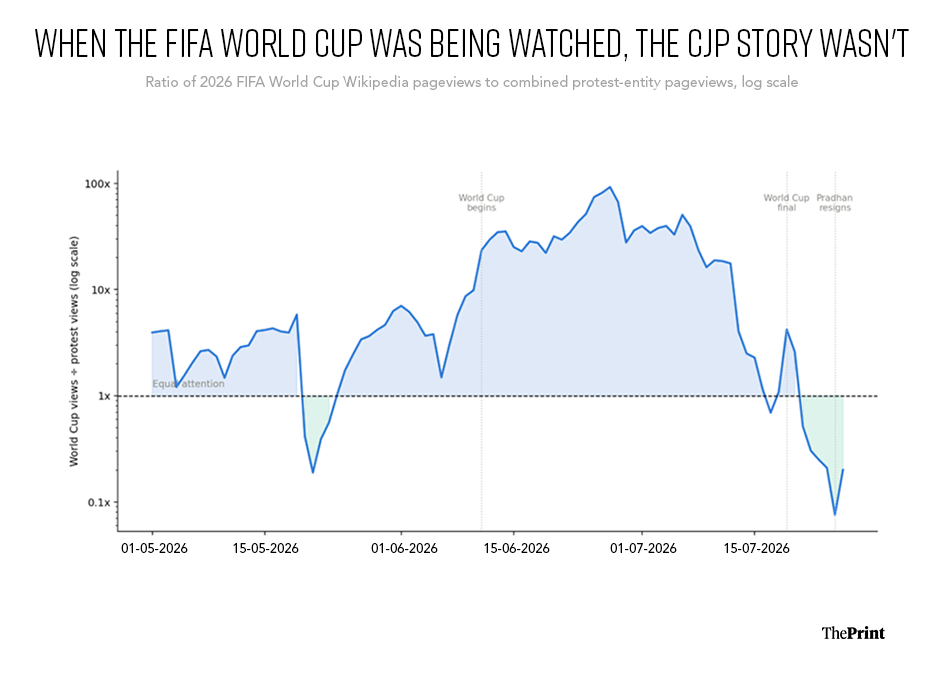
Nobody has figured out one key aspect: Why did the attention on the protests seem to explode specifically in the last week of July? Part of the answer is a football tournament nobody had considered a part of this story at all. The FIFA World Cup ran from 11 June to 19 July. For almost a month, the World Cup didn’t just get more attention than this story, it buried it. Wikipedia pageviews for the World Cup peaked at more than 92 times those for the protest on 27 June, while Wangchuk’s fast was already turning dangerous. Then the World Cup final happened on 19 July. Six days later, when Pradhan resigned, the ratio had flipped. The CJP story was pulling 13 times more attention than the tournament. However much of this may be coincidence, the findings show that a global sporting event ate the world’s attention for a month, and the moment it let go, the youth protest story exploded into the space it left behind.
Put the four findings together, and a different story emerges than “the news was too negative.” The news wasn’t necessarily wrong about the events themselves. But this analysis (limited to online platforms) shows it wasn’t where the most engaged parts of the online audience were actually following the story; it wasn’t aligned with how that audience actually felt about events as they happened; it wasn’t sensitive to the specific moments the public itself treated as most significant; and it didn’t address the one competing event that was quietly absorbing everyone’s attention for a month.
Four separate blind spots, each checkable against public data, and none of them showed up in the news coverage itself while the protests were underway. If you followed the story on your phone and found the news coverage didn’t match your experience, that isn’t a case of misremembering events. That is what the numbers say happened.
Disclaimer: The figures used in this article are drawn from public sources: Wikipedia’s pageview logs (via the Wikimedia REST API), YouTube API, and Google News search. The figures were scored using VADER (Valence Aware Dictionary and sEntiment Reasoner). One limitation of the analysis is that about half of the YouTube comments scored are in Hindi or Hinglish, which VADER cannot read reliably. If anything, this means the positive-audience finding in this piece is conservative rather than overstated.
The author is a researcher at the Global Poverty Research Laboratory at Kellogg School of Management, Northwestern University. His X handle is @pzaware19 and is on Instagram @pzspeaks.
(Edited by Prasanna Bachchhav)