








Every year, a day or two before the Union Budget, the government tables the Economic Survey. It is written by the Chief Economic Adviser, a technocrat independent of the Finance Ministry. It reads the way a technocrat’s document reads: chapters on growth, inflation, the current account, employment, each with the caveats a professional economist attaches to their own numbers. The next morning, the Finance Minister stands up and delivers the budget speech, a political document written to be read aloud to Parliament. The two describe the same economy in the same week. The natural question is how much the second document actually listens to the first.
I measured this directly by scraping the full text of every Economic Survey back to 1997-98, the earliest year the government’s own archive still has as readable text rather than a scanned image. Then I computed the shared distinctive vocabulary between each Survey and every budget speech using TF-IDF cosine similarity (common words in the document). If the budget is following the technocrat’s diagnosis, the Survey and the budget delivered right after it should be unusually similar to each other, more similar than either is to some other year’s pairing.
Most years, the answer is no
Across 28 years, the same-year pair, a Survey and the budget it precedes by a day, is only slightly more similar to each other than either is to a random other year. A lift of 1.33 times over the baseline. Put the other way, in only three of the 28 years I could measure, 2010, 2012, and 2021, is a Survey’s closest textual match in the entire record the budget that came right after it. In the other 25 years, some other year’s budget resembles the Survey more than the one it was written to accompany does.
This is not a story about one government or one Finance Minister failing to do their homework. It holds under Yashwant Sinha and Jaswant Singh’s BJP-led budgets, under P. Chidambaram and Pranab Mukherjee’s Congress-led ones, under Arun Jaitley and Nirmala Sitharaman’s. The Finance Minister’s speech is written from the government’s political priorities. The Survey is not required reading for it, whoever is holding the pen.
A Finance Minister who wasn’t listening at all
The weakest point in the whole 28-year record runs from 2001 to 2003, Yashwant Sinha’s last budget and Jaswant Singh’s first two. Same-year similarity in those years falls to 0.05 to 0.07, essentially indistinguishable from noise, sitting right on the baseline you would get from pairing the Survey with a budget chosen at random. Whatever the Chief Economic Adviser diagnosed in those years, the budget speech was not built from it, not even loosely.
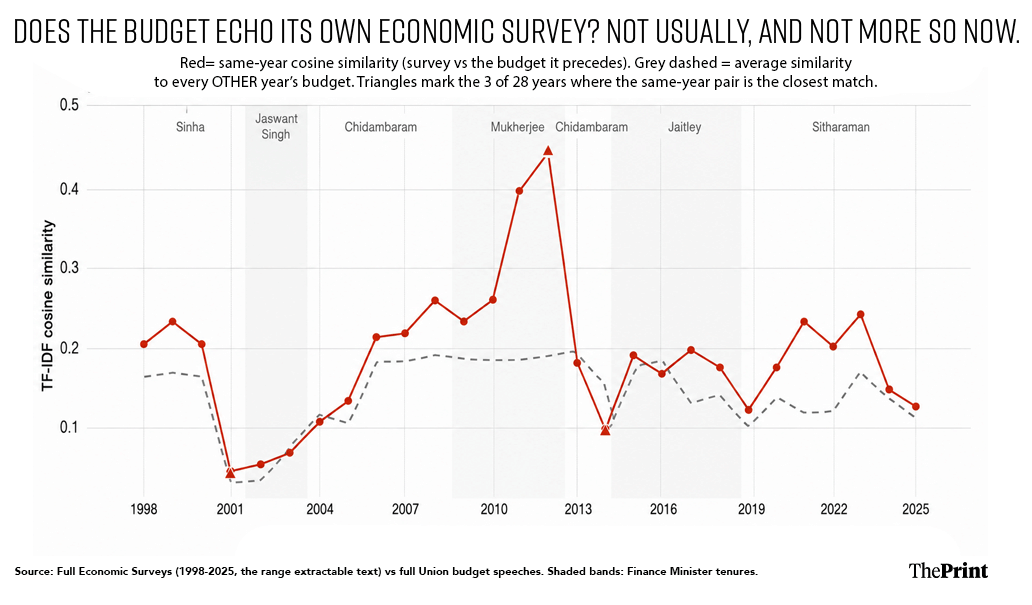 Same-year cosine similarity (red) against the average similarity to every other year’s budget (grey dashed), 1998-2025. Triangles mark the 3 of 28 years where the same-year pair is the closest match in the entire record. Shaded bands are Finance Minister tenures.
The exception: Pranab Mukherjee
Then there is 2010 to 2012. Same-year similarity climbs to 0.26, then 0.40, then 0.45 in 2012, roughly double the next-highest year in the entire record and nearly three times that year’s own baseline. Those three budgets are Pranab Mukherjee’s, presented in the second UPA term. No other Finance Minister, in either party, before or after, tracked their own Survey anywhere near as closely.
It is tempting to read a personality into this, and maybe there is one. But the more useful reading is structural: it proves the low similarity everywhere else is a choice, not a constraint the format imposes. Nothing about the budget speech as a genre prevents a Finance Minister from building it around the Survey’s own diagnosis. Mukherjee did it for three years running. Almost everyone else, across eight decades, did not.
What actually crosses over: the register, not the substance
A natural next question is whether the low overall similarity is hiding something more specific: maybe the Survey’s factual review of the past year growth, inflation, the numbers already in the record does carry into the budget. While the Survey’s more ambitious forward-looking proposals a deregulation push, a new financing framework get quietly left on the table.
I built two small word lists to test this directly: one retrospective (grew, increased, recorded, achieved, review), one prescriptive (should, must, recommend, framework, reform, pilot, deregulation), and measured how much of each list’s usage in the Survey the same-year budget also picks up.
The result runs the opposite way, and by a wide margin. Prescriptive language carries over at roughly 0.63; retrospective language at roughly 0.26, less than half as much. In nearly every one of the 28 years. Not as an average, but because a few outliers are dragging it around. If anything crosses from the Survey into the budget, on this measure, it is the aspirational vocabulary, not the settled facts.
I do not think this proves budgets faithfully adopt the Survey’s specific reform ideas, and I want to be honest about why.
Words like should, framework, and strengthen are the connective tissue of almost any government economic document, whichever ministry wrote it and whatever it is actually proposing. A chapter on agriculture and a chapter on digital payments both reach for framework.
So this test cannot distinguish a budget that adopted the Survey’s particular proposal from a budget that simply writes in the same bureaucratic register the Survey does. The retrospective words, by contrast, are often anchored to a specific number, and the budget may cite different specific numbers than the Survey discussed even when both documents are doing real retrospective work.
What the test can support is narrower than either hypothesis: the two documents share a vocabulary of aspiration more consistently than they share a vocabulary of record. Whether that aspiration is ever cashed out is a question this kind of word count cannot settle on its own; it would take tracing a Survey’s specific named proposals one at a time into the budget that followed, which is a case-by-case exercise, not a dictionary.
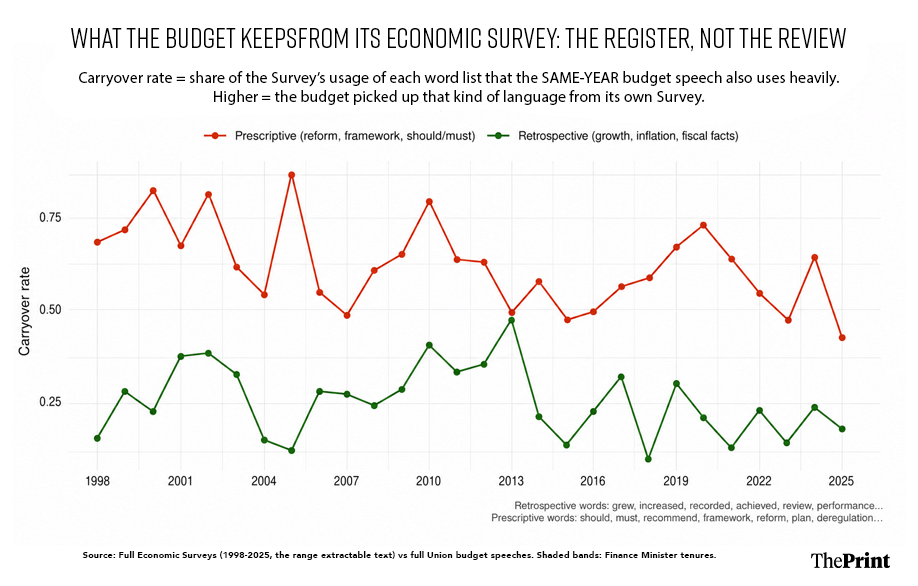 Carryover rate: share of the Survey’s usage of each word list that the same-year budget also uses heavily, 1998-2025. Prescriptive vocabulary (should, must, framework, reform) carries over roughly twice as consistently as retrospective vocabulary (grew, increased, recorded, achieved).
Also read: Indians employ a unique mechanism to marry science and faith. It leaves both hollow
What the words can’t tell you
Two limits are worth stating plainly. Surveys before 1997-98 are scanned images on the government’s own archive with no text layer underneath them, so the 28-year window is the honest ceiling for this method, not a choice to stop early; getting further back would mean OCR on decades-old scanned documents, and I was not confident the output would be clean enough to trust in a word-level comparison.
Second, four budget speeches from 2008 to 2012 were missing from the public archive in the form I needed and had to be separately recovered and lightly cleaned for this comparison alone; they are not part of the topic-model analysis elsewhere in this series.
None of this changes the shape of the finding. Across eight decades of Indian budget-making, in nearly every year on record, the Finance Minister’s speech is not a response to the technocrat’s diagnosis delivered the morning before. It is its own document, written from its own priorities. For three years in the middle of the record, someone actually picked up the report on the way to the podium. The other twenty-five years are the rule; those three are worth noticing precisely because they are not.
A note on method: full Economic Surveys (1998-2025, English, all chapters) and full Union budget speeches were compared using TF-IDF cosine similarity over a shared vocabulary. The retrospective/prescriptive word-list comparison uses the same TF-IDF weighting, computed over the combined corpus of all Surveys and all budget speeches so common connective words are appropriately downweighted. Full methodology available on request.
Piyush Zaware is a graduate researcher in economics at the University of Chicago and a researcher at the Global Poverty Research Laboratory at Northwestern Kellogg School of Management. This is the third and final piece in a three-part series reading seven decades of Union budget speeches as data.
(Edited by Ratan Priya)