


Last month, the central government released the annual Status Paper on Government Debt. The report provides a detailed analysis of the debt position of the central, state and general government for the year 2021-22.
There has been a noticeable improvement in the debt position since the alarming levels of the Covid-period. The debt is however still higher than the pre-Covid levels. An important part of the report is the Government’s medium-term debt management strategy that details the government’s tolerance towards risk while maintaining a lower cost of borrowing.
The Fiscal Responsibility and Budget Management (FRBM) Act, 2003, needs to be amended to provide an updated fiscal and debt consolidation roadmap in view of the changing domestic and global economic environment.
Also read: States spending better, with many prioritising capex. But those dependent on Centre may face stress
Trends in public debt: Global & India
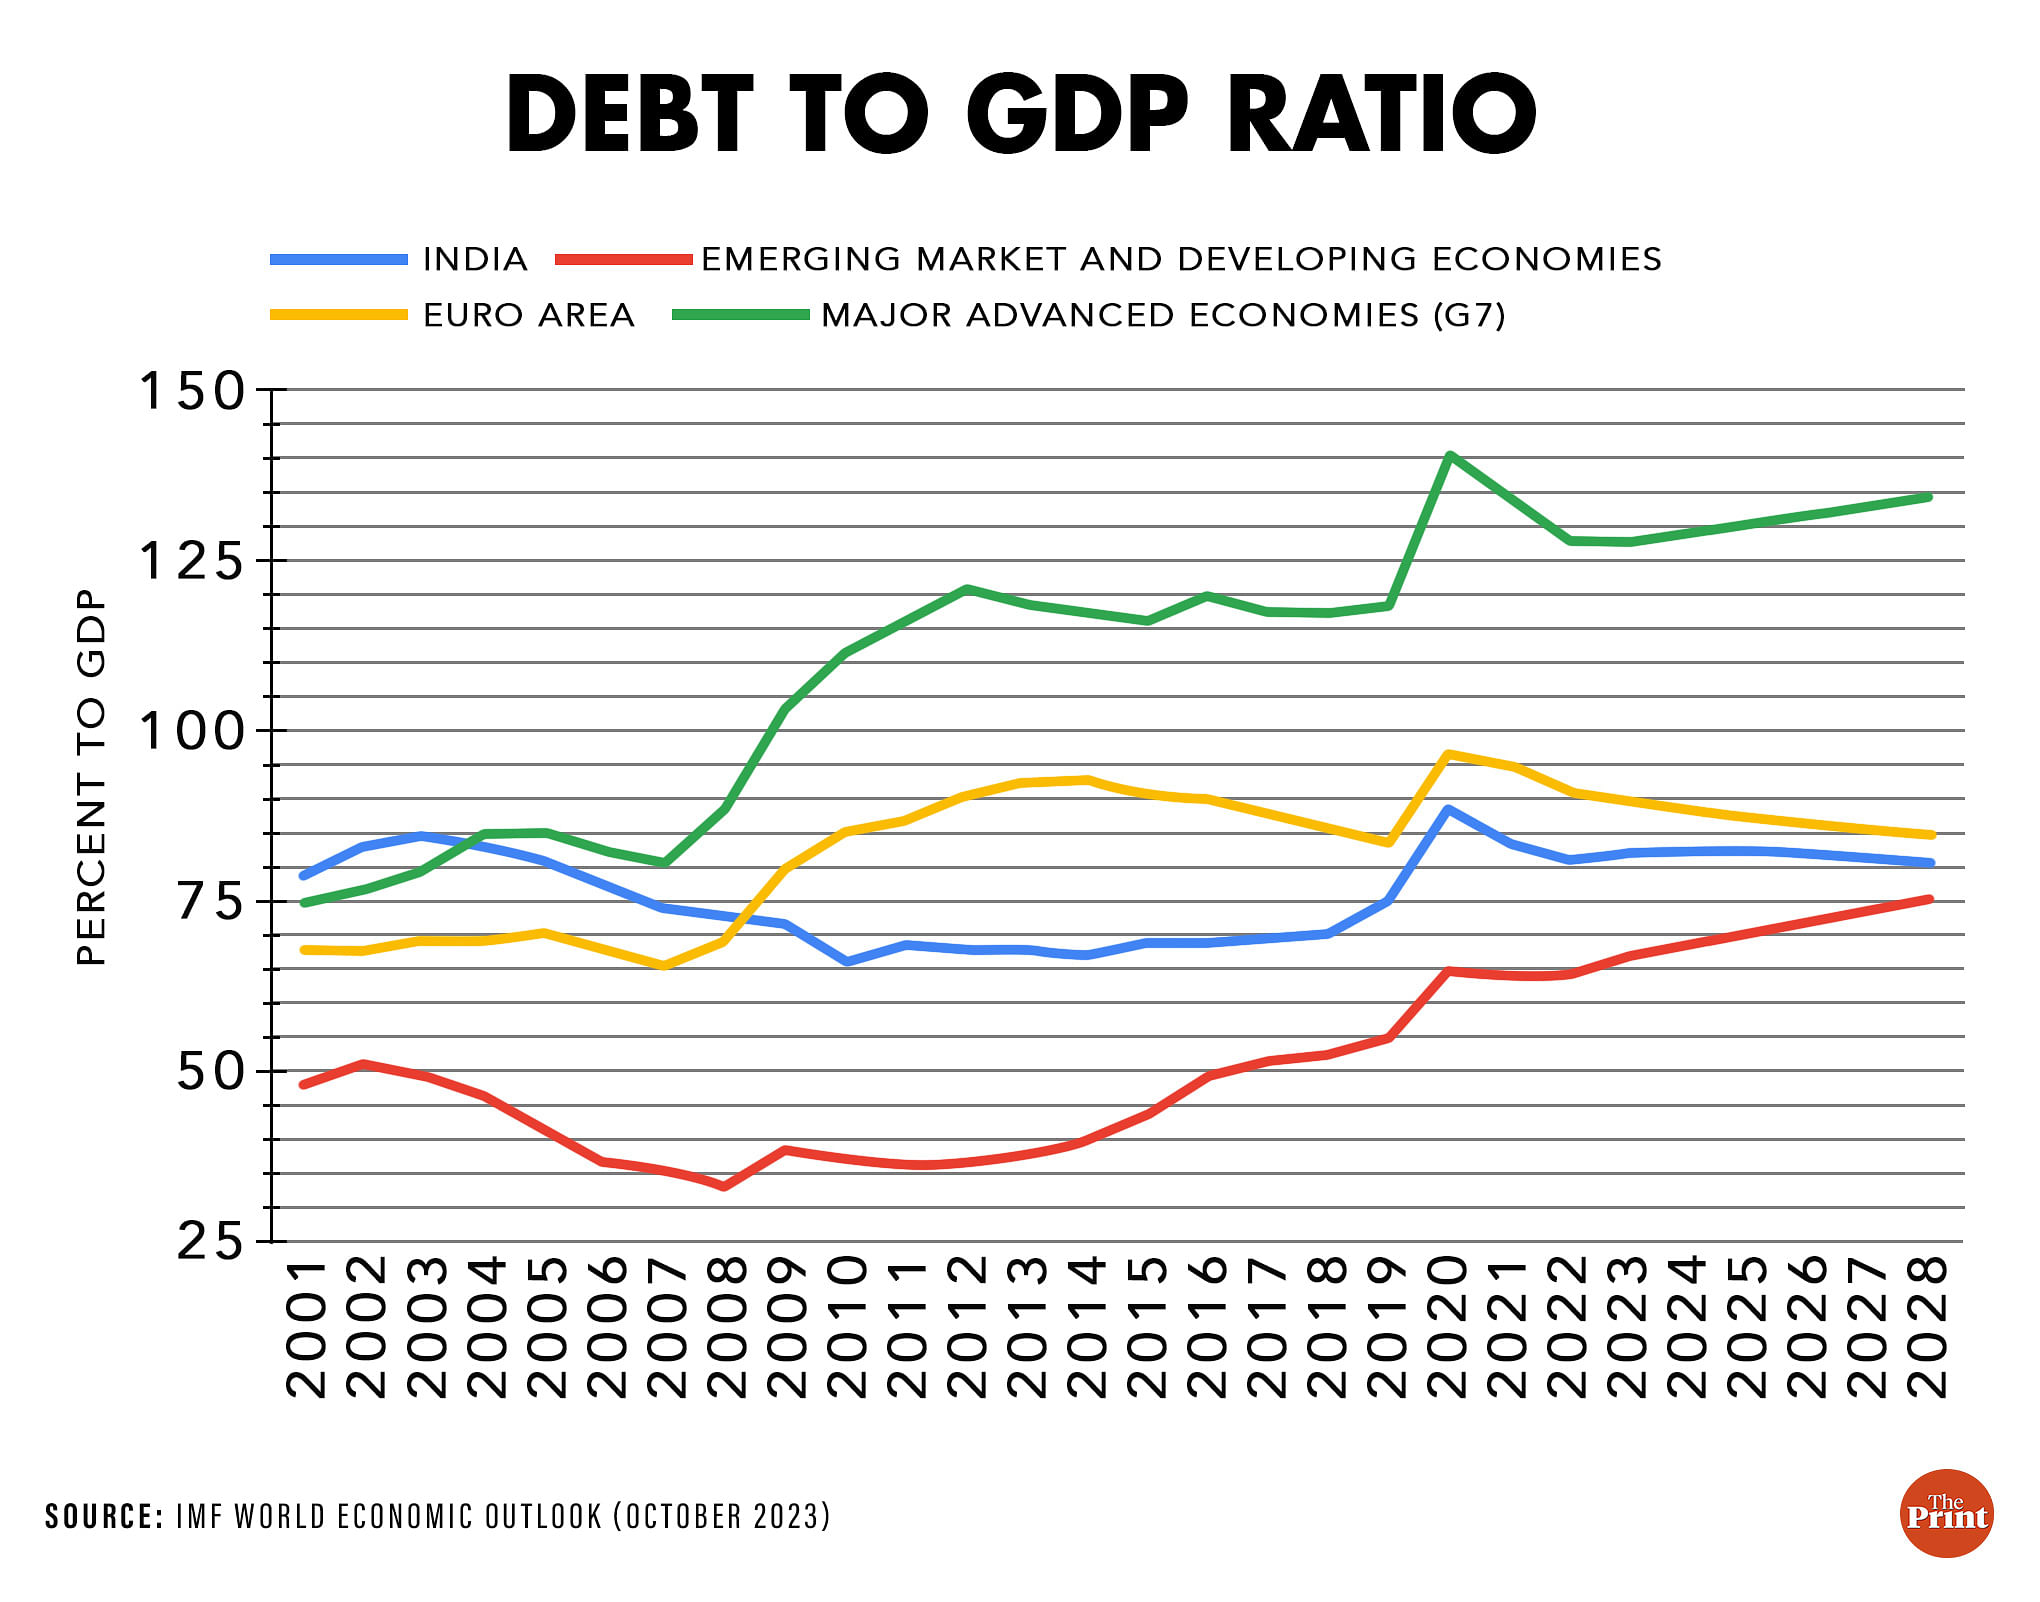
According to the International Monetary Fund’s (IMF) Global Debt Monitor, 2023, global public debt zoomed to 100.4 percent of GDP in 2020. It declined to 96 percent of GDP in 2021 and 92.4 percent in 2022. While the decline in debt has been significant, it is still 7.5 percentage points above its 2019 levels. Almost 30 percent of the global public debt is owed by developing economies, of which roughly 70 percent is owed by China, India and Brazil.
For India, the general government debt which had surged to 87.8 percent of GDP as of end March 2021, came down to 83.3 percent as of end-March 2022. This is still higher than the pre-Covid debt-GDP ratio of 75 percent.
The central government debt, which had risen to 61.5 percent of GDP in 2020-21, came down to 59.1 percent of GDP by end March 2022. Debt of the state governments declined from 31 percent in 2020-21 to 28.9 percent in 2021-22.
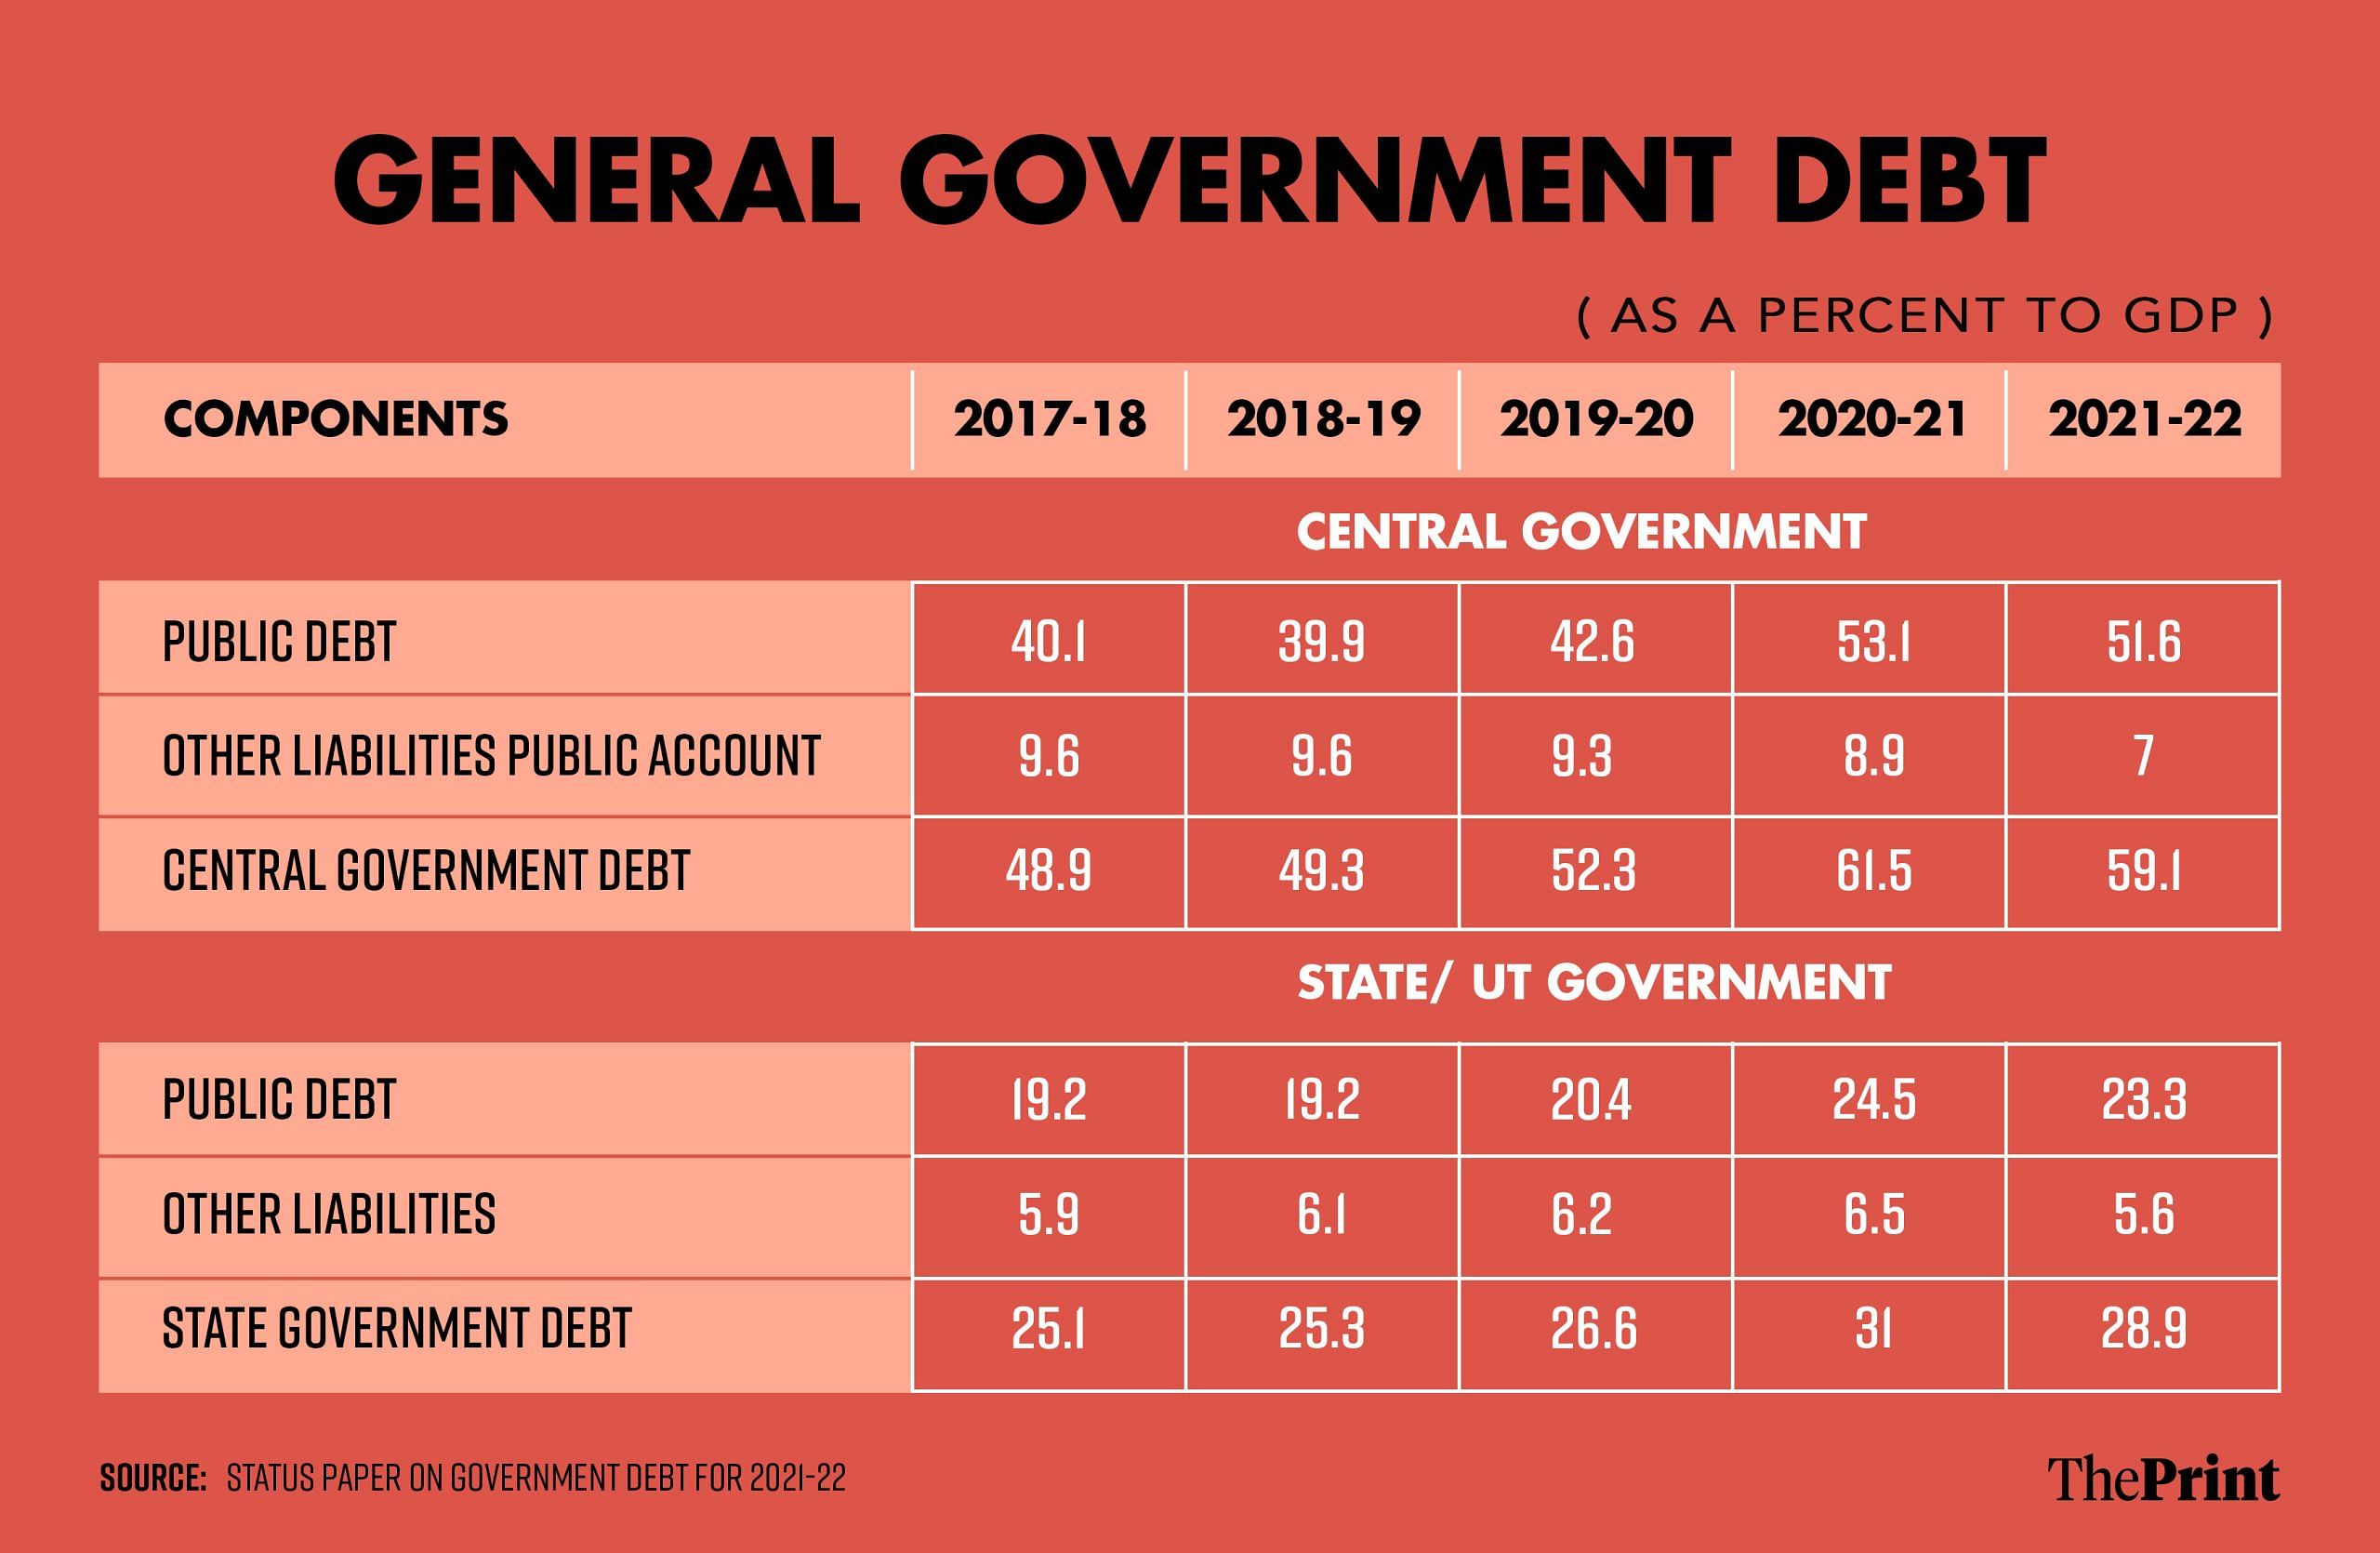
From 2020-21 to 2021-22, there was a significant decline of 4.5 percentage points in the general government debt. The sharp decline was supported by a rebound in GDP, after a sharp contraction during the pandemic. Going forward, the decline in the debt trajectory is expected to be gradual.
According to the October edition of the IMF’s World Economic Outlook (WEO), India’s general government debt to GDP ratio will likely remain above 80 percent till 2028. From 83.75 percent in 2021-22, the general government debt to GDP ratio has likely fallen to 81.02 percent in 2022-23, before rising marginally to 81.89 percent in 2023-24. The ratio is projected to rise further to 82.30 percent in 2024-25, before following a consistent downward trajectory.
A debt consolidation plan needed
The FRBM Act had earlier mandated that the central government would endeavour to limit the general government debt to 60 percent of GDP and the central government debt to 40 percent of GDP, by the end of financial year, 2024-25.
The FRBM Act needs to be amended to provide a revised debt and fiscal consolidation roadmap.
In light of Covid and other disruptions, the government wanted to maintain the flexibility in responding to economic uncertainties and did not provide a medium-term projection for debt and fiscal deficit in the Statement of Fiscal Policy released along with the budget, from 2020-21. While for fiscal deficit, in the absence of a glide path, there is a medium-term target of 4.5 percent of GDP to be achieved in 2025-26. But for debt, there is no such goal post.
The Fifteenth Finance Commission had recommended a debt and deficit reduction path for central and state government till 2025-26. But the report was submitted in November 2020. Necessary changes in the FRBM Act in light of the changing macro-economic landscape and a debt and deficit reduction plan should be introduced without delay. This would give clarity on the government’s strategy towards fiscal and debt consolidation.
Debt management strategy & benchmarks determining debt portfolio
A crucial element of the status paper is the government’s medium-term debt management strategy, which outlines the plan to manage debt at low cost over the medium to long run, consistent with a prudent degree of risk. The present report covers the period from 2022-2025. Public debt is subject to multiple risks: currency risk, roll-over risk, market risk, commodity price risk. The strategy provides a framework within which the debt managers need to manage financing of debt while navigating the risks and constraints.
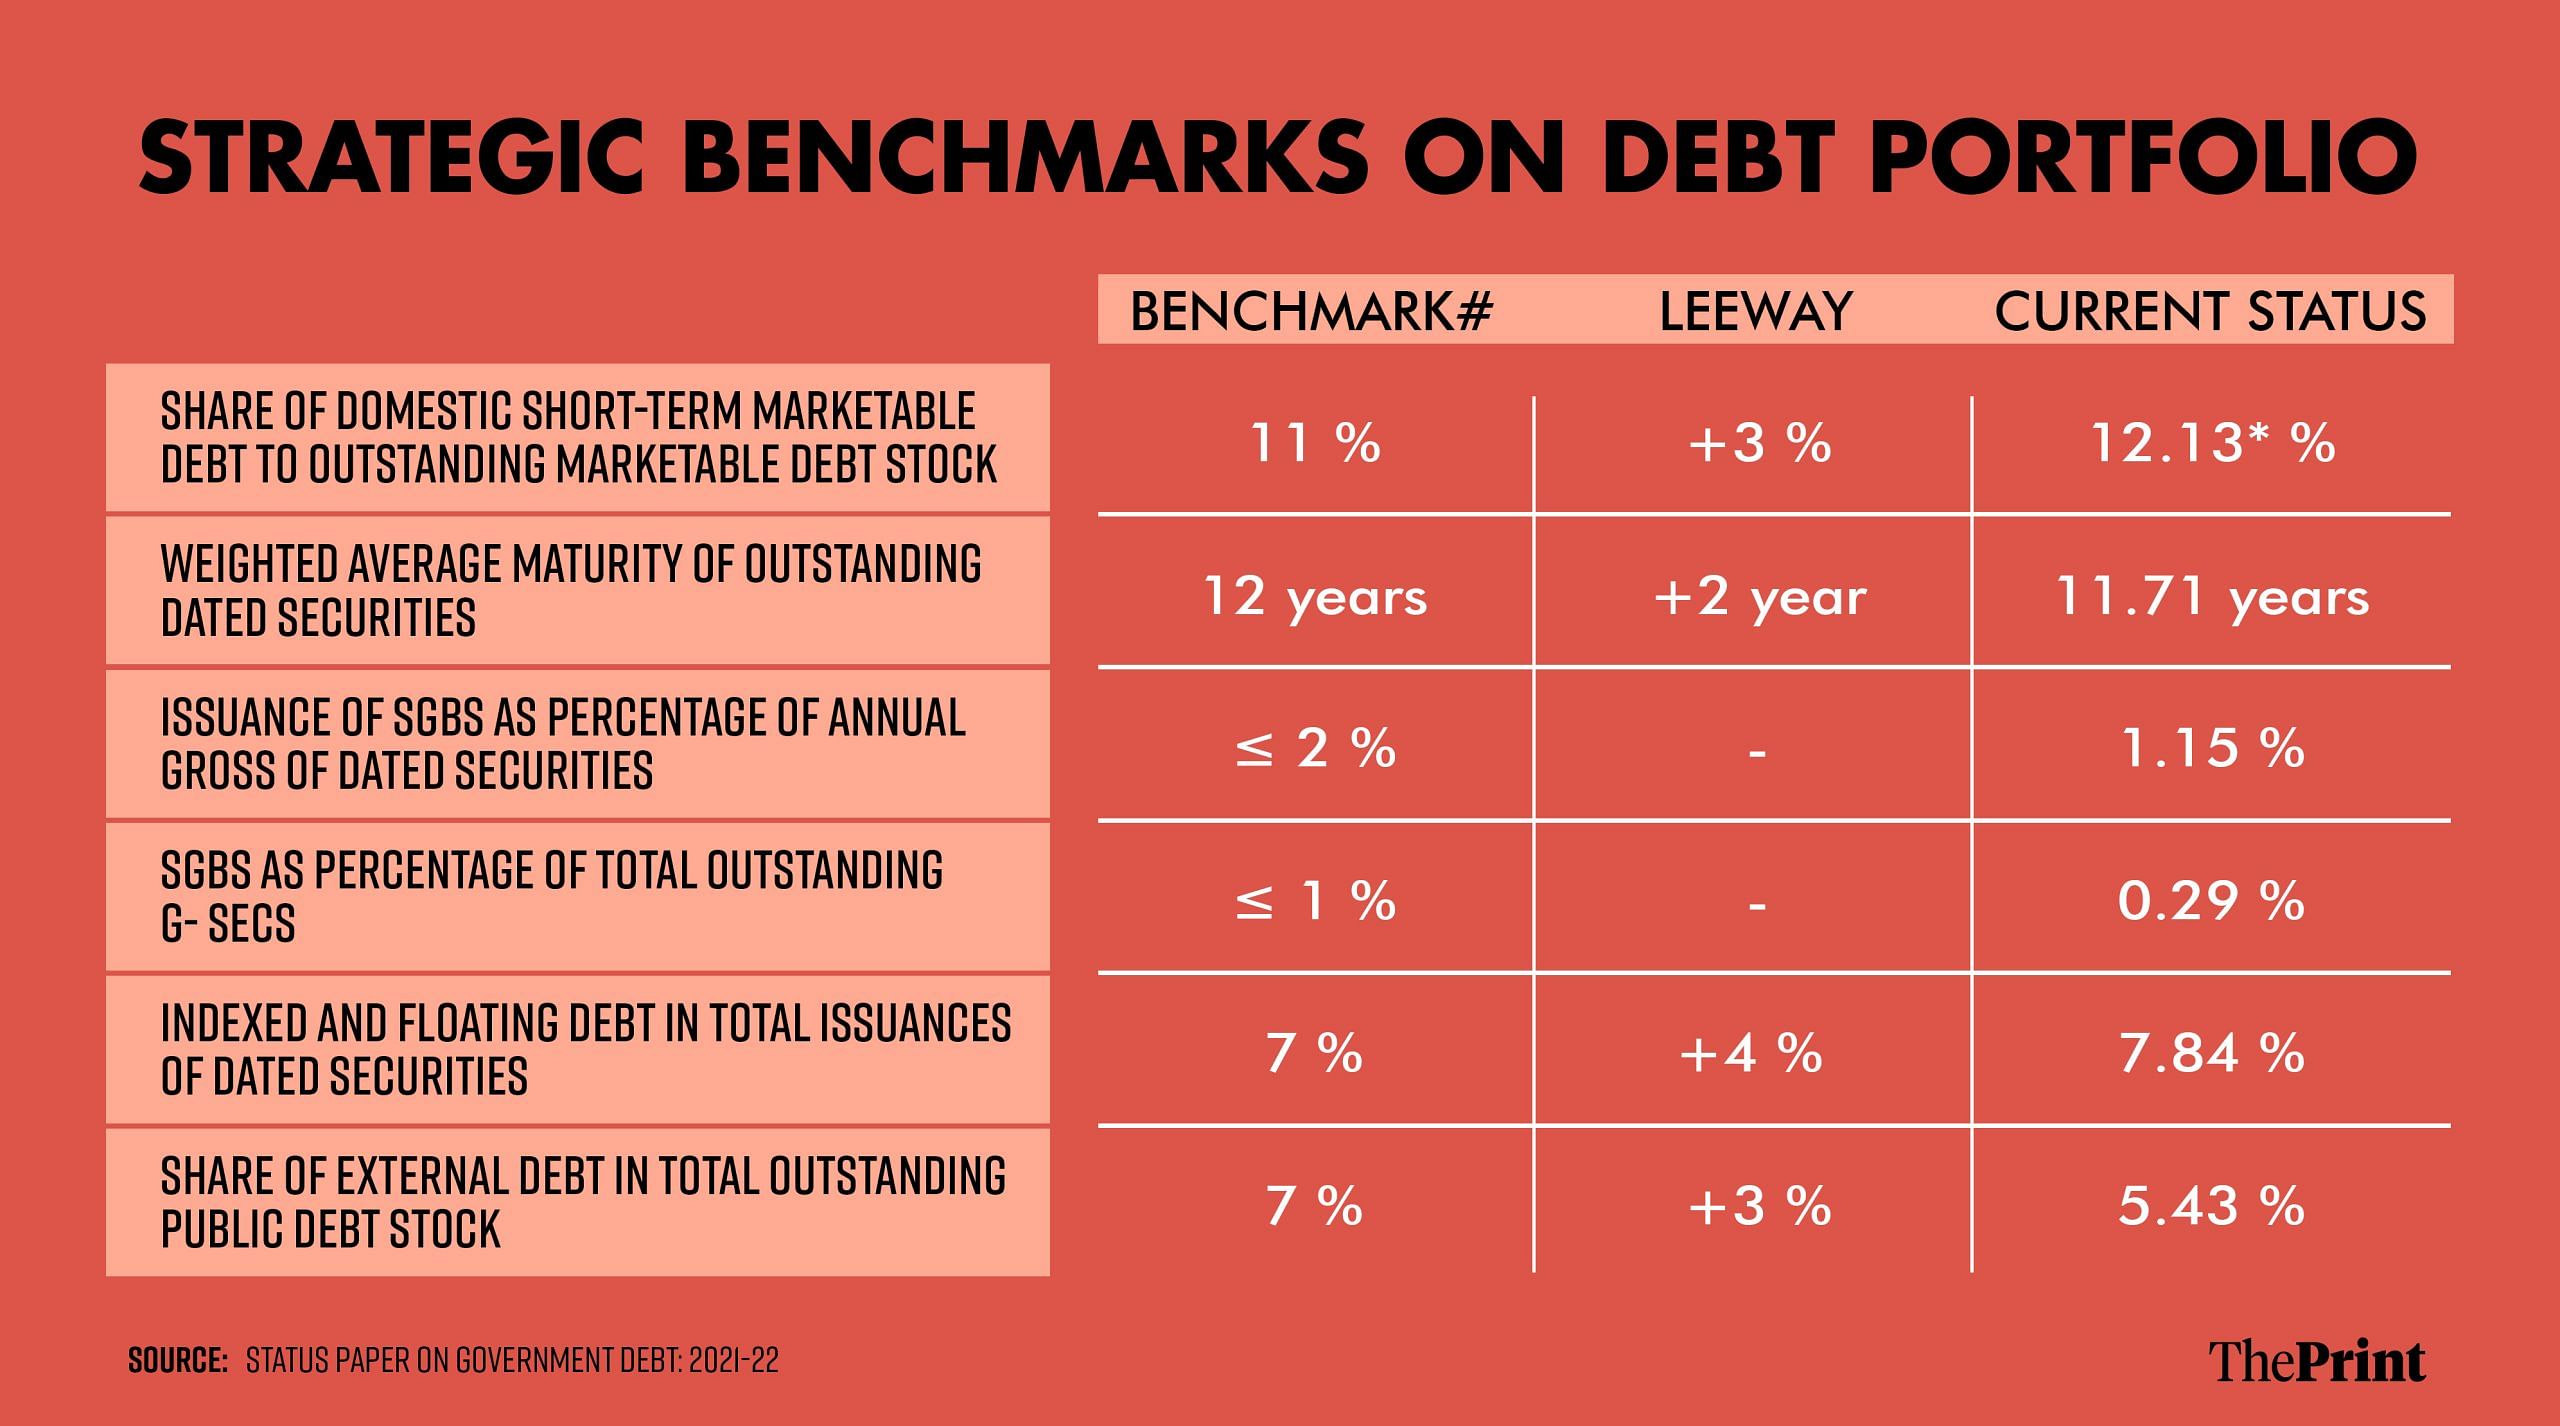
The debt management strategy presents some strategic benchmark indicators of debt portfolio. These indicators capture the structure and composition of the debt portfolio and provide an assessment of the government’s tolerance towards risk, while lowering the cost of debt. Some of the benchmark indicators include, for instance, the share of short-term in the outstanding debt, the share of external debt in the outstanding debt and the weighted average maturity of debt.
A higher share of short-term debt can potentially lower the cost of borrowing but can subject the debt portfolio to higher roll-over risk. The central government aims to bring down the short-term debt within 11 percent of the outstanding debt (with a leeway of +- 3 percent). In 2021-22, the share of short-term debt was 12.13 percent of the outstanding debt stock. The government seems open to increasing the share of external debt in the total outstanding debt to 7 percent. In 2021-22, the share of external debt was 5.43 percent of the outstanding debt.
Low liquidity in debt market continues to pose a challenge
The debt management strategy lays emphasis on improving the liquidity in the secondary market through increasing the number of participants. Only a handful of securities witness higher trading volumes.
According to the latest edition of the quarterly report on public debt management, the top 10 traded central government securities accounted for 83.39 percent of the total trading volume in the secondary market in April-June of 2023-24.
The share of top 3 securities alone accounted for 63 percent of the trading volume. To be sure, this is a decline from 68.1 percent share in the previous quarter, implying some progress towards diversification of trading pattern.
In the state debt market as well, the securities of the top five states accounted for more than 52 percent of the total trading in July-September of 2023-24.
The government’s status paper presents a consolidated picture of the debt position and lays emphasis on improving the liquidity in the debt market through diversifying the investor base.
In light of the inclusion of India’s sovereign bonds in the JP Morgan global bond index, the debt management strategy and benchmark indicators governing the debt portfolio would need to be reviewed. There is also a need for a more timely release of this important policy document on government debt.
Radhika Pandey is associate professor at National Institute of Public Finance and Policy (NIPFP).
Views are personal.
Also read: Low or high, inflation a pain point in poll-bound states. Parties assure sops to ease rising prices