


New Delhi: More than a third of India’s poor, or 415 million people, were pushed out of multidimensional poverty between 2005 and 2021, shows analysis of the United Nations Development Program’s (UNDP’s) updated poverty index data.
The data of 110 developing countries, collected over varying time periods, indicates that this fall is likely to be the steepest.
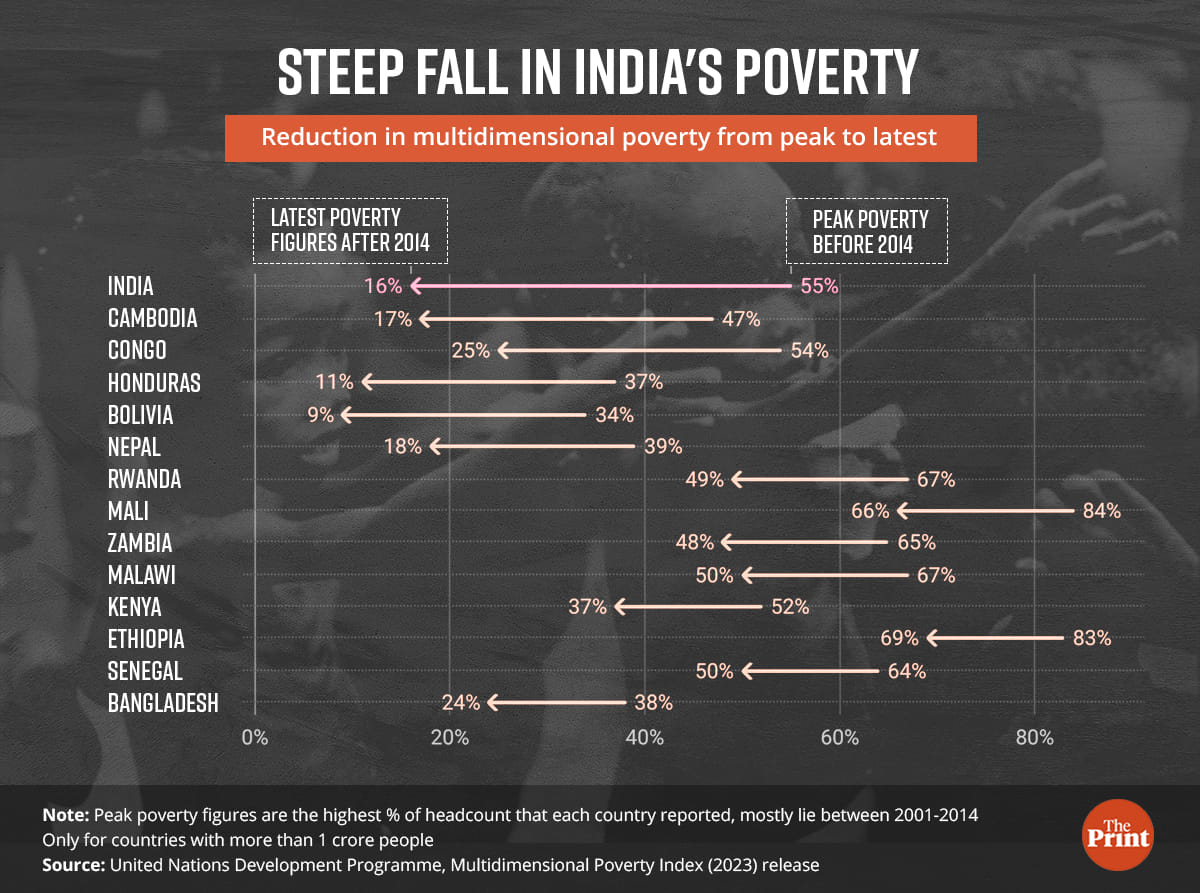
According to the UNDP’s updated Multidimensional Poverty Index (MPI) report, released Tuesday, about 55 percent of India was living under ‘multidimensional poverty’ by 2005-06. This halved to 27.7 percent by 2015-16, and reduced further to 16.4 percent by 2019-21.
In simpler words, around one in every two Indians were considered poor in 2005-06 owing to deprivation of education, health and standard of living. By 2019-21, this number was down to one among six.
Unlike standard definitions of poverty estimates which comprise the level of income and consumption of calories, MPI measures poverty by taking into account more factors such as health, education and living standards, which are further broken down into 10 sub-indicators. It takes into account demographics and health surveys, multiple indicator surveys, and national surveys that these countries release periodically.
Notably, the poverty measurement period is different for different countries. Most countries had at least one round of survey before 2014, and all 110 countries had at least two rounds of survey after that. For several countries, data is not available for some time periods.
Since each country had a different timeline of reducing poverty, ThePrint calculated the average percentage of poor people pushed out of multidimensional poverty.
Turns out that Congo pushed out about 3.2 percent of its population out of poverty every year between 2005 and 2014, bringing down multidimensional poverty to 25 percent from about 54 percent in just 9 years.
Congo is followed by Cambodia, which uplifted about 2.77 percent of its population each year between 2010 and 2021. India comes next with 2.76 percent population moving out of multidimensional poverty each year between 2005 and 2021.
India’s neighbour Pakistan, which is facing an economic crisis, reduced its poverty to 38.3 percent in 2017 from 44.5 percent in 2012 (a 6.1 percentage point decline), Bangladesh by 13.5 percentage points — 24.1 percent in 2019 from 37.6 percent in 2014. In Nepal, multidimensional poverty declined to 17.7 percent in 2019 from 39.1 percent in 2011.
So how did India manage to achieve this feat? Experts believe the “devil lies in the details”.
According to Santosh Mehrotra, an economics professor at Jawaharlal Nehru University’s Centre for Informal Sector and Labour Studies, this level of poverty reduction could primarily be attributed to improved sanitation and access to clean drinking water.
“If you look at the data, most of the reduction in India’s multidimensional poverty happened before this new government stepped in. They have done quite well in terms of sanitation and drinking water, and that is reflected in these figures, but beyond that, the data doesn’t show much improvement,” he told ThePrint.
Also Read: Did UP economy do better under Akhilesh than Yogi? A data-check on state’s $1-trillion ambition
Key lies in standard of living
Since 2021, the NITI Aayog — the Union government’s apex public policy think tank — has been releasing its own variant of the multidimensional poverty index.
Those involved in the NITI Aayog’s index agree with JNU professor Mehrotra, that India’s reduction in multidimensional poverty has largely come from the standard of living components such as cooking fuel, clean water, sanitation, access to electricity, housing and assets.
“Health, education and nutrition are generational indicators which take a significant amount of time to show results whereas indicators pertaining to standard of living are relatively easier to deliver. However, India is leaving no stone unturned to improve these. The National Education Policy (NEP) and other efforts on healthcare have already started showing results,” one official involved in the NITI Aayog index told ThePrint.
However, professor Mehrotra doesn’t share the same optimism. “The government’s ability to spend on sectors like health and education comes from its ability to raise revenues, which has suffered significantly post demonetisation and the GST. This is also complemented by its conservatism in spending on these particular sectors — which makes it unlikely for them to (further) reduce poverty ratios,” he said.
He added: “If poverty has declined in India so rapidly, why is the government not releasing the official, income-based poverty estimates? What’s the need of providing free food grain if a vast majority of the country is no longer poor?”
(Edited by Smriti Sinha)
Also Read: Delhi, Mumbai India’s ‘most liveable cities’ & Bengaluru not far behind, shows Economist data