New Delhi: India recorded its first case of the novel coronavirus on 30 January in Kerala, when a student of Wuhan University returned from China. After a few cases in February, the numbers started climbing in March, and there has been no let-up since.
The numbers are telling as India is now the fourth worst-hit country with a caseload of 4,73,105. As of Thursday, 25 June, the number of active cases stands at 1,86,514.
Starting Thursday, ThePrint will daily bring you all the figures related to the Covid pandemic, tracking the number of total positive cases, tests done, active cases and recoveries, positivity rate, and deaths.
The detailed graphs put together by our team will give you a quick snapshot of the country’s daily battle with the pandemic. It will also, over a period of time, track how India has upped its game, or not, as it approaches the ‘peak’ — an important landmark in infectious diseases because it is after a peak has been achieved that the cases start coming down.
Active cases

The total number of Covid cases in India has been on a steady upward curve, except for a transient flattening between 15 June and 16 June. Active cases are an important metric because the total number that also includes recoveries and deaths can be tad misleading and magnify the extent of spread of the disease.
Testing numbers
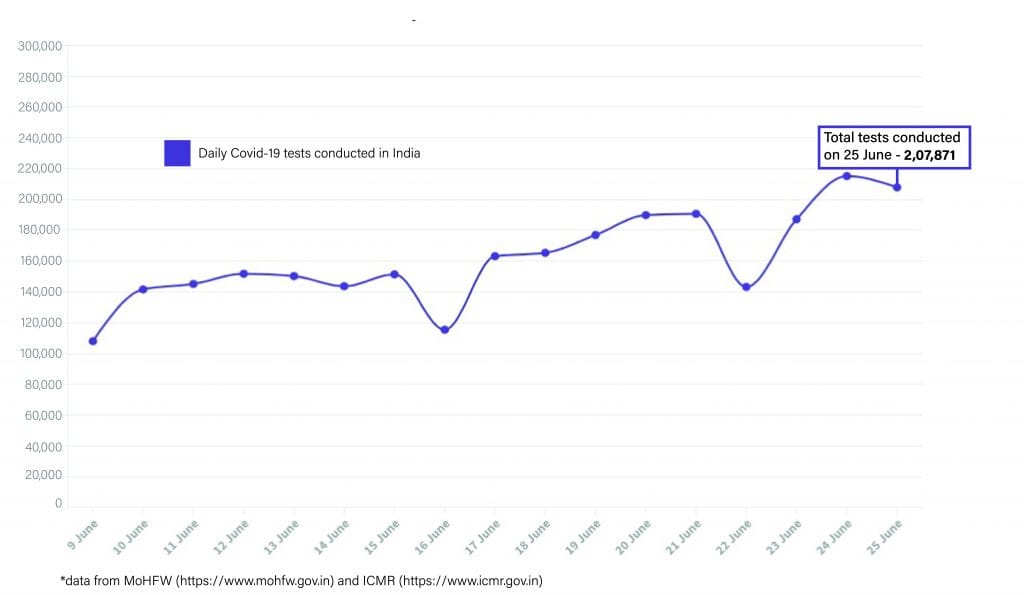
Except for a weekly dip on Sundays, India’s daily tests have increased substantially over time. However, the worm here is clearly climbing the hill much slower than the one in the graph on active cases. Testing is an important parameter because even within a given testing strategy, the more the numbers tested, the more likely are the chances of spotting a case. No tests, no positives.
Mortality rate
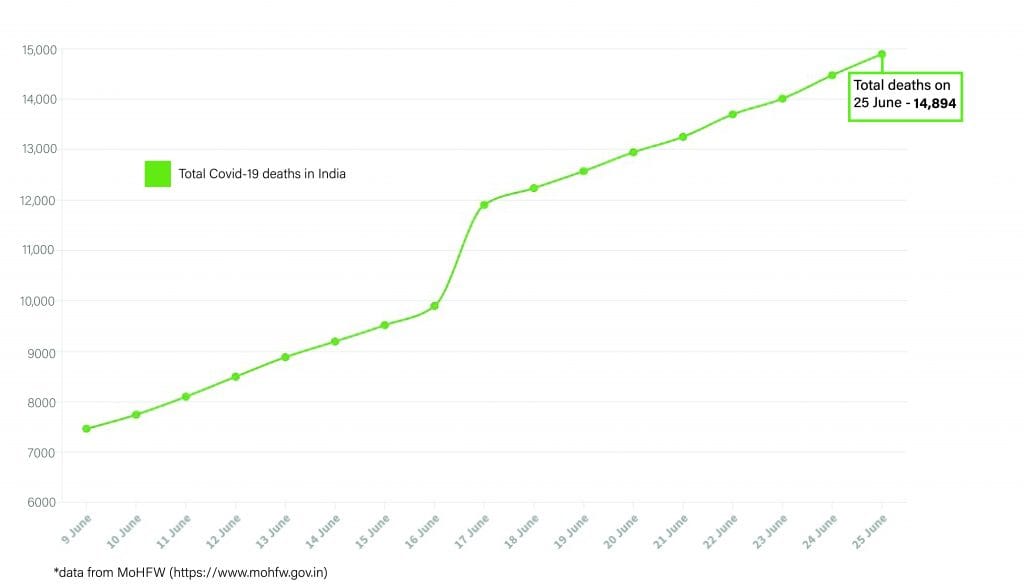
India’s mortality rate is about 3% currently, lower than the global average. However, the numbers of Covid deaths every day are going up. The sharp rise between 16 June and 17 June was when figures from states like Delhi and Maharashtra were updated, with earlier deaths that had not initially been attributed to Covid being added to the toll.
Positivity rate
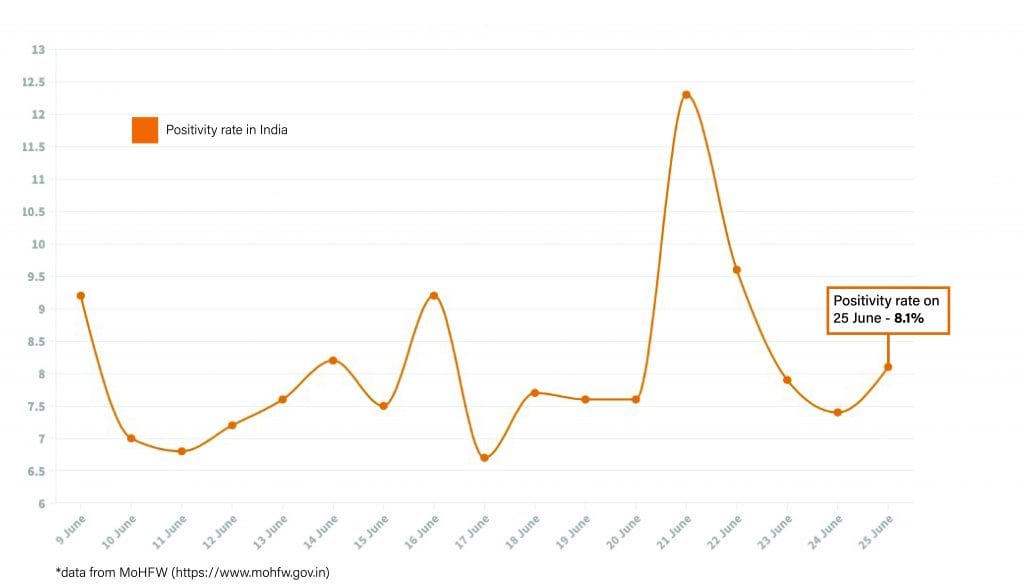
Even though the numbers have been going up, India’s national positivity rate — the number of positives among the numbers of samples tested — has not shown huge variations except a weekly spike on Sundays when the total tests reduce in number. Reduction in testing is usually associated with a rise in positivity. One notable exception is on 30 June when the positivity rate spiked, inexplicably, even without a fall in testing numbers.
Recovered cases
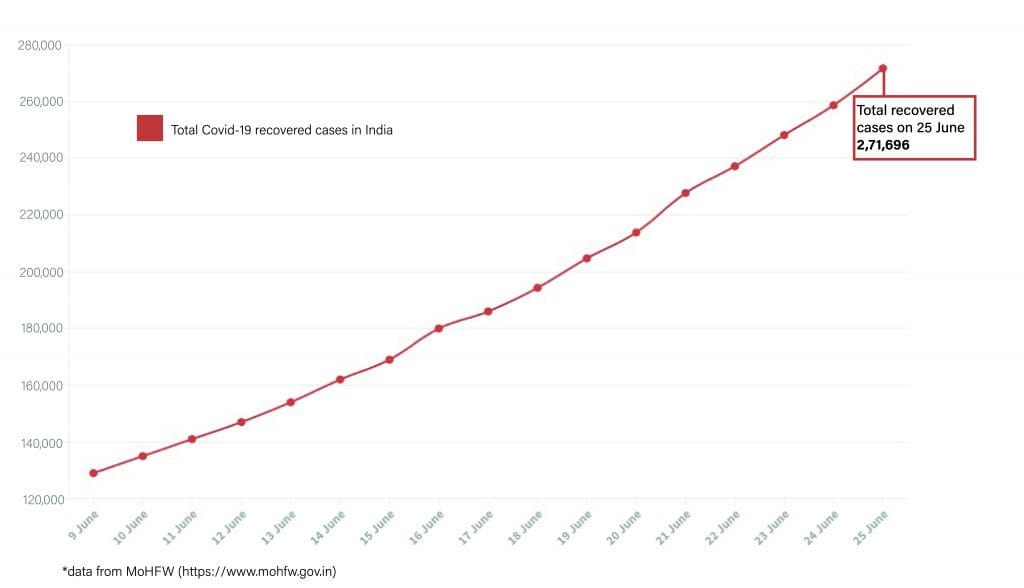
This is a good news graph. The curve of recovered cases is also an almost mirror image of the curve of total cases. This is because the recovery rate calculated as a percentage of total closed cases rather than the total cases comes to a very high 94.8%.
Total count
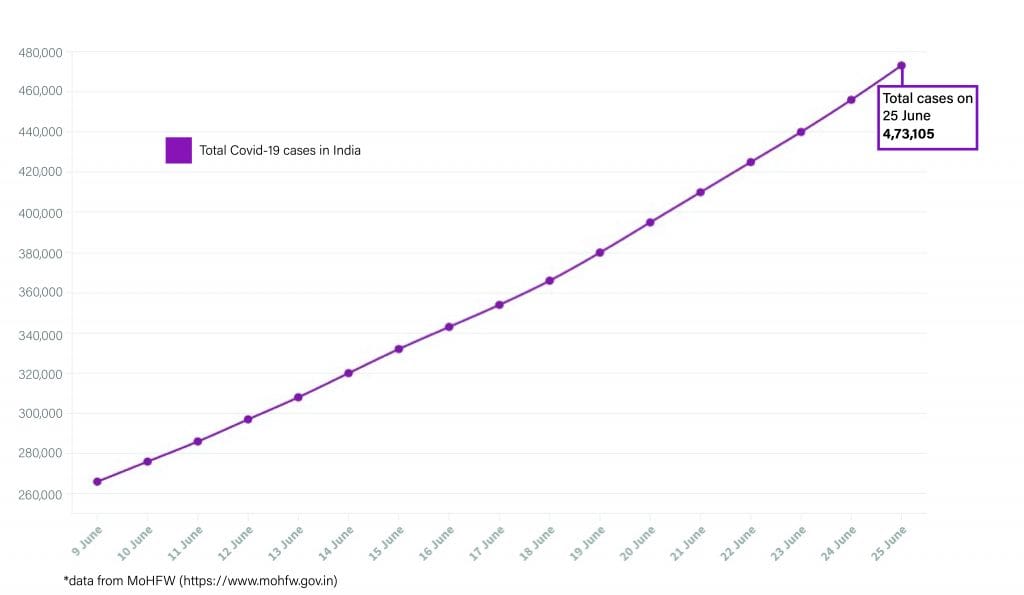
This graph represents the size of the epidemic in India and how it is changing on a daily basis. The graph is still on an upward slope. Where it starts bending is when India starts getting the better of the novel coronavirus.
Across India
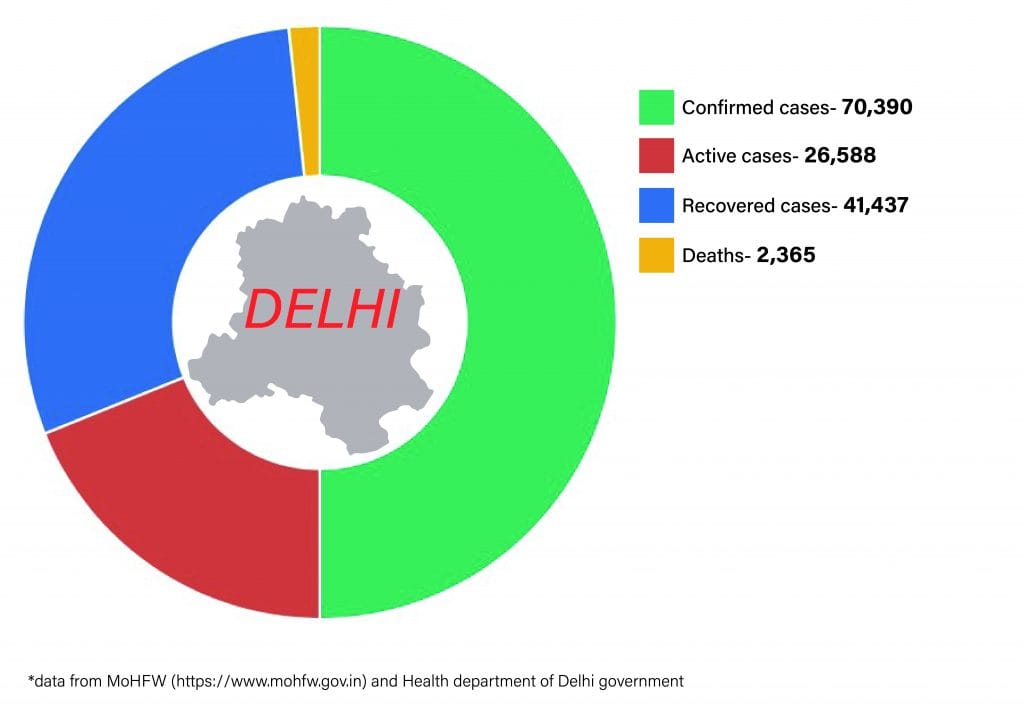
The national capital is now the city with the most number of Covid cases in the country. Its death rate of about 3.3%, though is comparable to the national average.
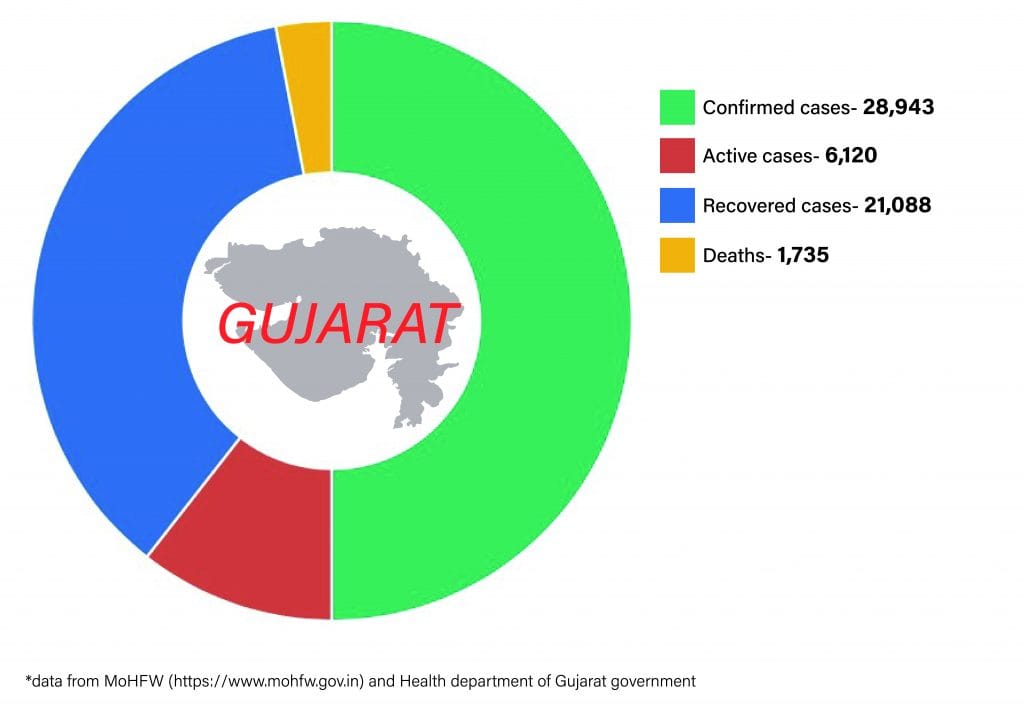
Gujarat, despite its very high mortality rate of 6.9%, has only 6,120 active cases. This could be a ray of hope for the state.
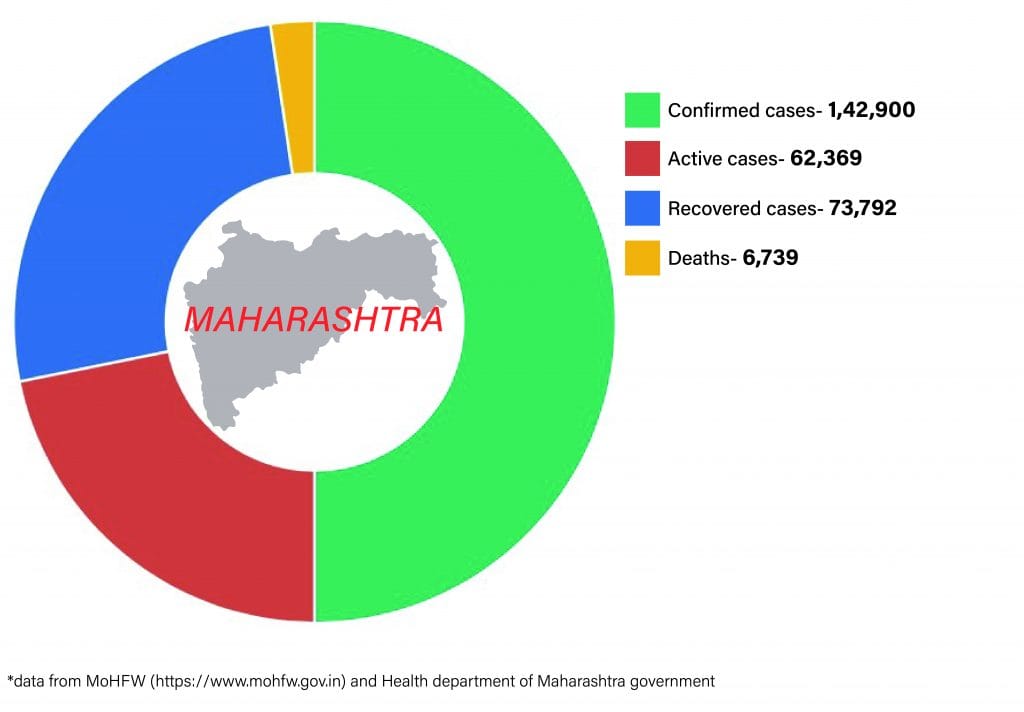
Maharashtra has the most number of cases in the country and also a death rate of 4.7%. Mumbai, Thane, Nashik and Pune have been the biggest contributors to these numbers.
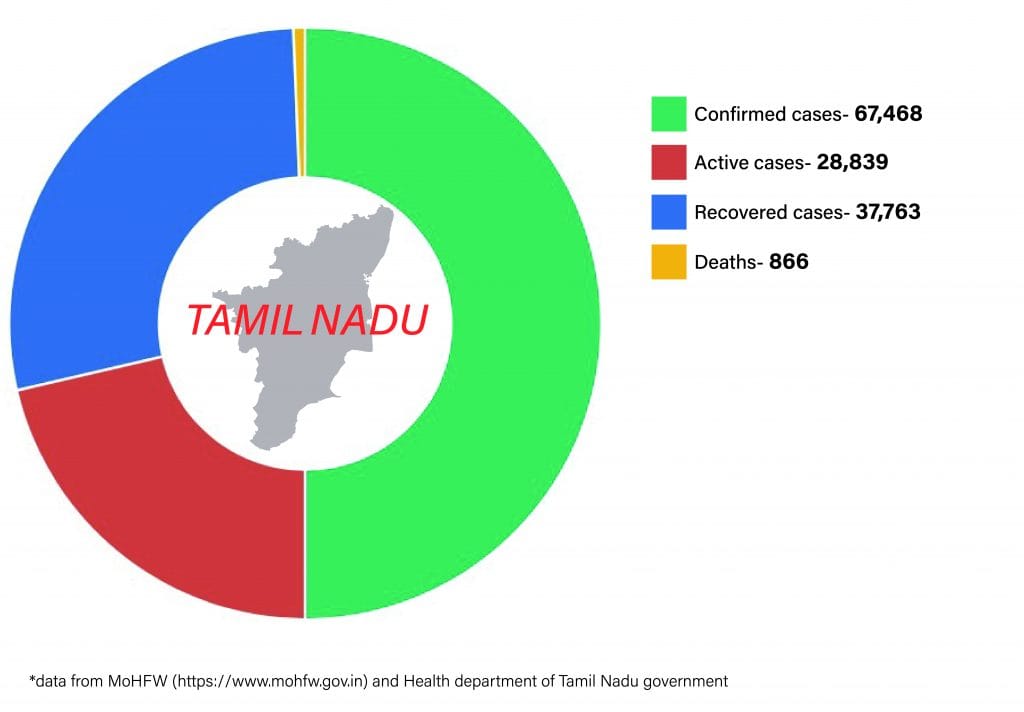
Tamil Nadu has a high caseload, but its death rate is quite low at below 2%. This could be a sign of the maturity of the health system in the state.
Tests and positive cases
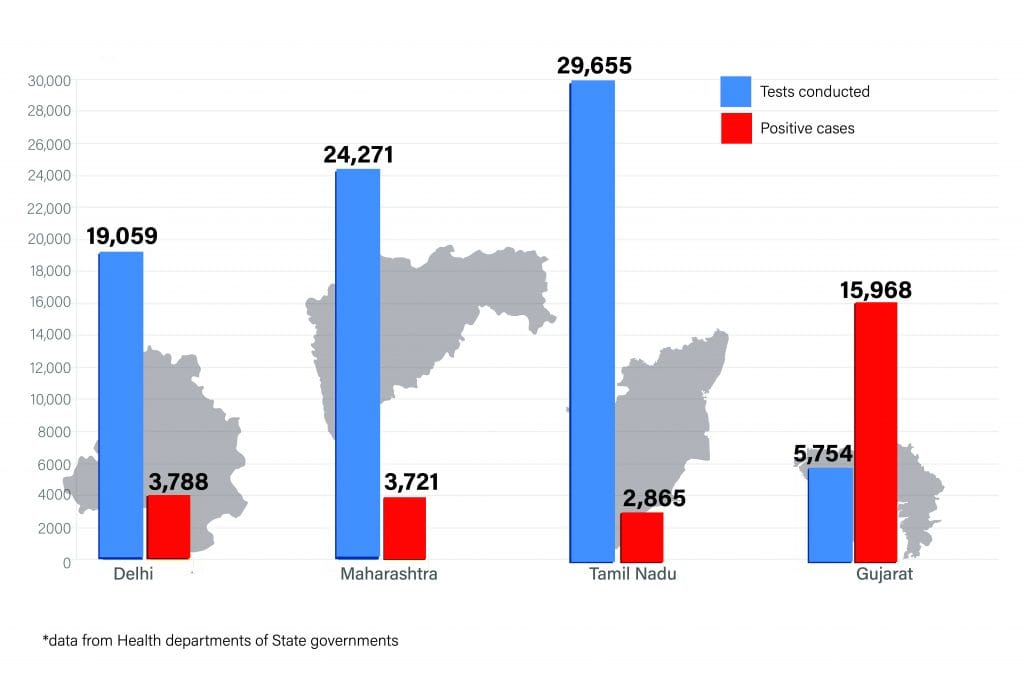
The daily comparison of the tests done and the positive cases found is an important metric in deciding whether a state needs to expand its testing base. Going easy on testing is often the first option for state governments who want to keep the daily numbers down.


