


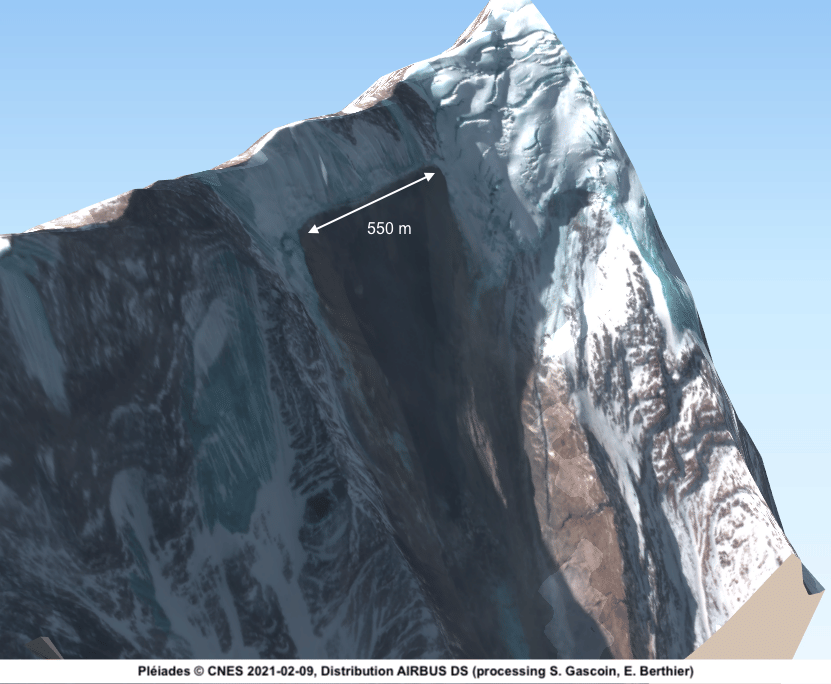
Chennai: Satellite images from the site of the landslide that is believed to have triggered the Uttarakhand flood Sunday show a 550-metre-wide “scar” left in its wake on the shoulder of the Nanda Ghunti peak, at a prominence called Ronti peak.
The scar is what remains after chunks of ice and rock broke off a wall of ice in a rock slope failure — or landslide — from a glacier on the Ronti peak, satellite images from an international initiative to track disasters show.
After Uttarakhand was struck by floods Sunday, French space agency National Centre for Space Studies (CNES) directed the International Charter on Space and Major Disasters, a global collaboration of satellites, to the site of the disaster.
Images captured by the French earth-imaging satellite constellation Pléiades on 9 February, two days after the floods, revealed the site of the landslide that triggered the devastating floods.
Fresh images from the European Union Copernicus’ Sentinel-2 also showed the site of the landslide and the scar.
And the landslide that possibly triggered the debris flow, as seen in today's #Sentinel2 acquisition pic.twitter.com/Z413jBenW2
— Sotiris Valkaniotis (@SotisValkan) February 10, 2021
Several international researchers have been using different technologies — from satellite images to geotagged data — to shed more light on what exactly happened in Uttarakhand Sunday.
Over 30 people died in the floods, with scores yet missing four days later.
Also Read: Uttarakhand disaster likely caused by landslide, not glacial outburst, satellite images reveal
An international effort
The International Charter on Space and Major Disasters is a collaborative effort where global space agencies direct satellites towards immediate disaster response efforts. It was set up in November 2000.
It comprises 17 participants, including the space agencies of the EU, France, Canada, India, Russia, Argentina, Japan, UK, China, Brazil, Bolivia, and UAE, aerospace agencies in South Korea and Germany, as well as meteorological agencies like the United States’ National Oceanic and Atmospheric Administration (NOAA), United States Geological Survey (USGS), and European Organisation for the Exploitation of Meteorological Satellites (EUMETSAT).
A total of 61 satellites are part of the collaboration, and data from these satellites are provided free of cost to users.
The Pléiades constellation consists of two high resolution satellites, 1A and 1B, that were launched in 2011 and 2012, respectively. The two satellites are in the same orbit, 180 degrees apart (on opposite sides of the planet at any point of time).
They also share the same orbit as the SPOT 6 and 7 satellites, also from France, making all of them 90 degrees apart from one another. The satellite imagery is obtained and orthorectified or geometrically corrected to make it more accurate to real life.
The Pléiades constellation can capture images within a ground strip of 800 km width, with a 70cm resolution. It has a repeat cycle of 26 days, which means it passes over the same location every 26 days. The satellites are in a sun-synchronous orbit, where the satellite passes over a point each time at the same time of day. They orbit at an altitude of 695 km and an inclination of 98.2 degrees.
The Copernicus Sentinel-2 mission also consists of a constellation of two polar orbiting satellites placed in the same sun-synchronous orbit, phased 180 degrees apart.
The first few images from the site of the Uttarakhand floods, which led to immediate identification of the landslide by Dr Dan Shugar, were provided by Planet Labs, a firm that provides Earth-imaging services.
Understanding what happened
According to the Pléiades images, the chunks of ice and rock that broke off the Nanda Ghunti peak’s glacier dropped a height of two kilometres before hitting the Ronti valley floor, triggering an avalanche in the Ronti gad (valley).
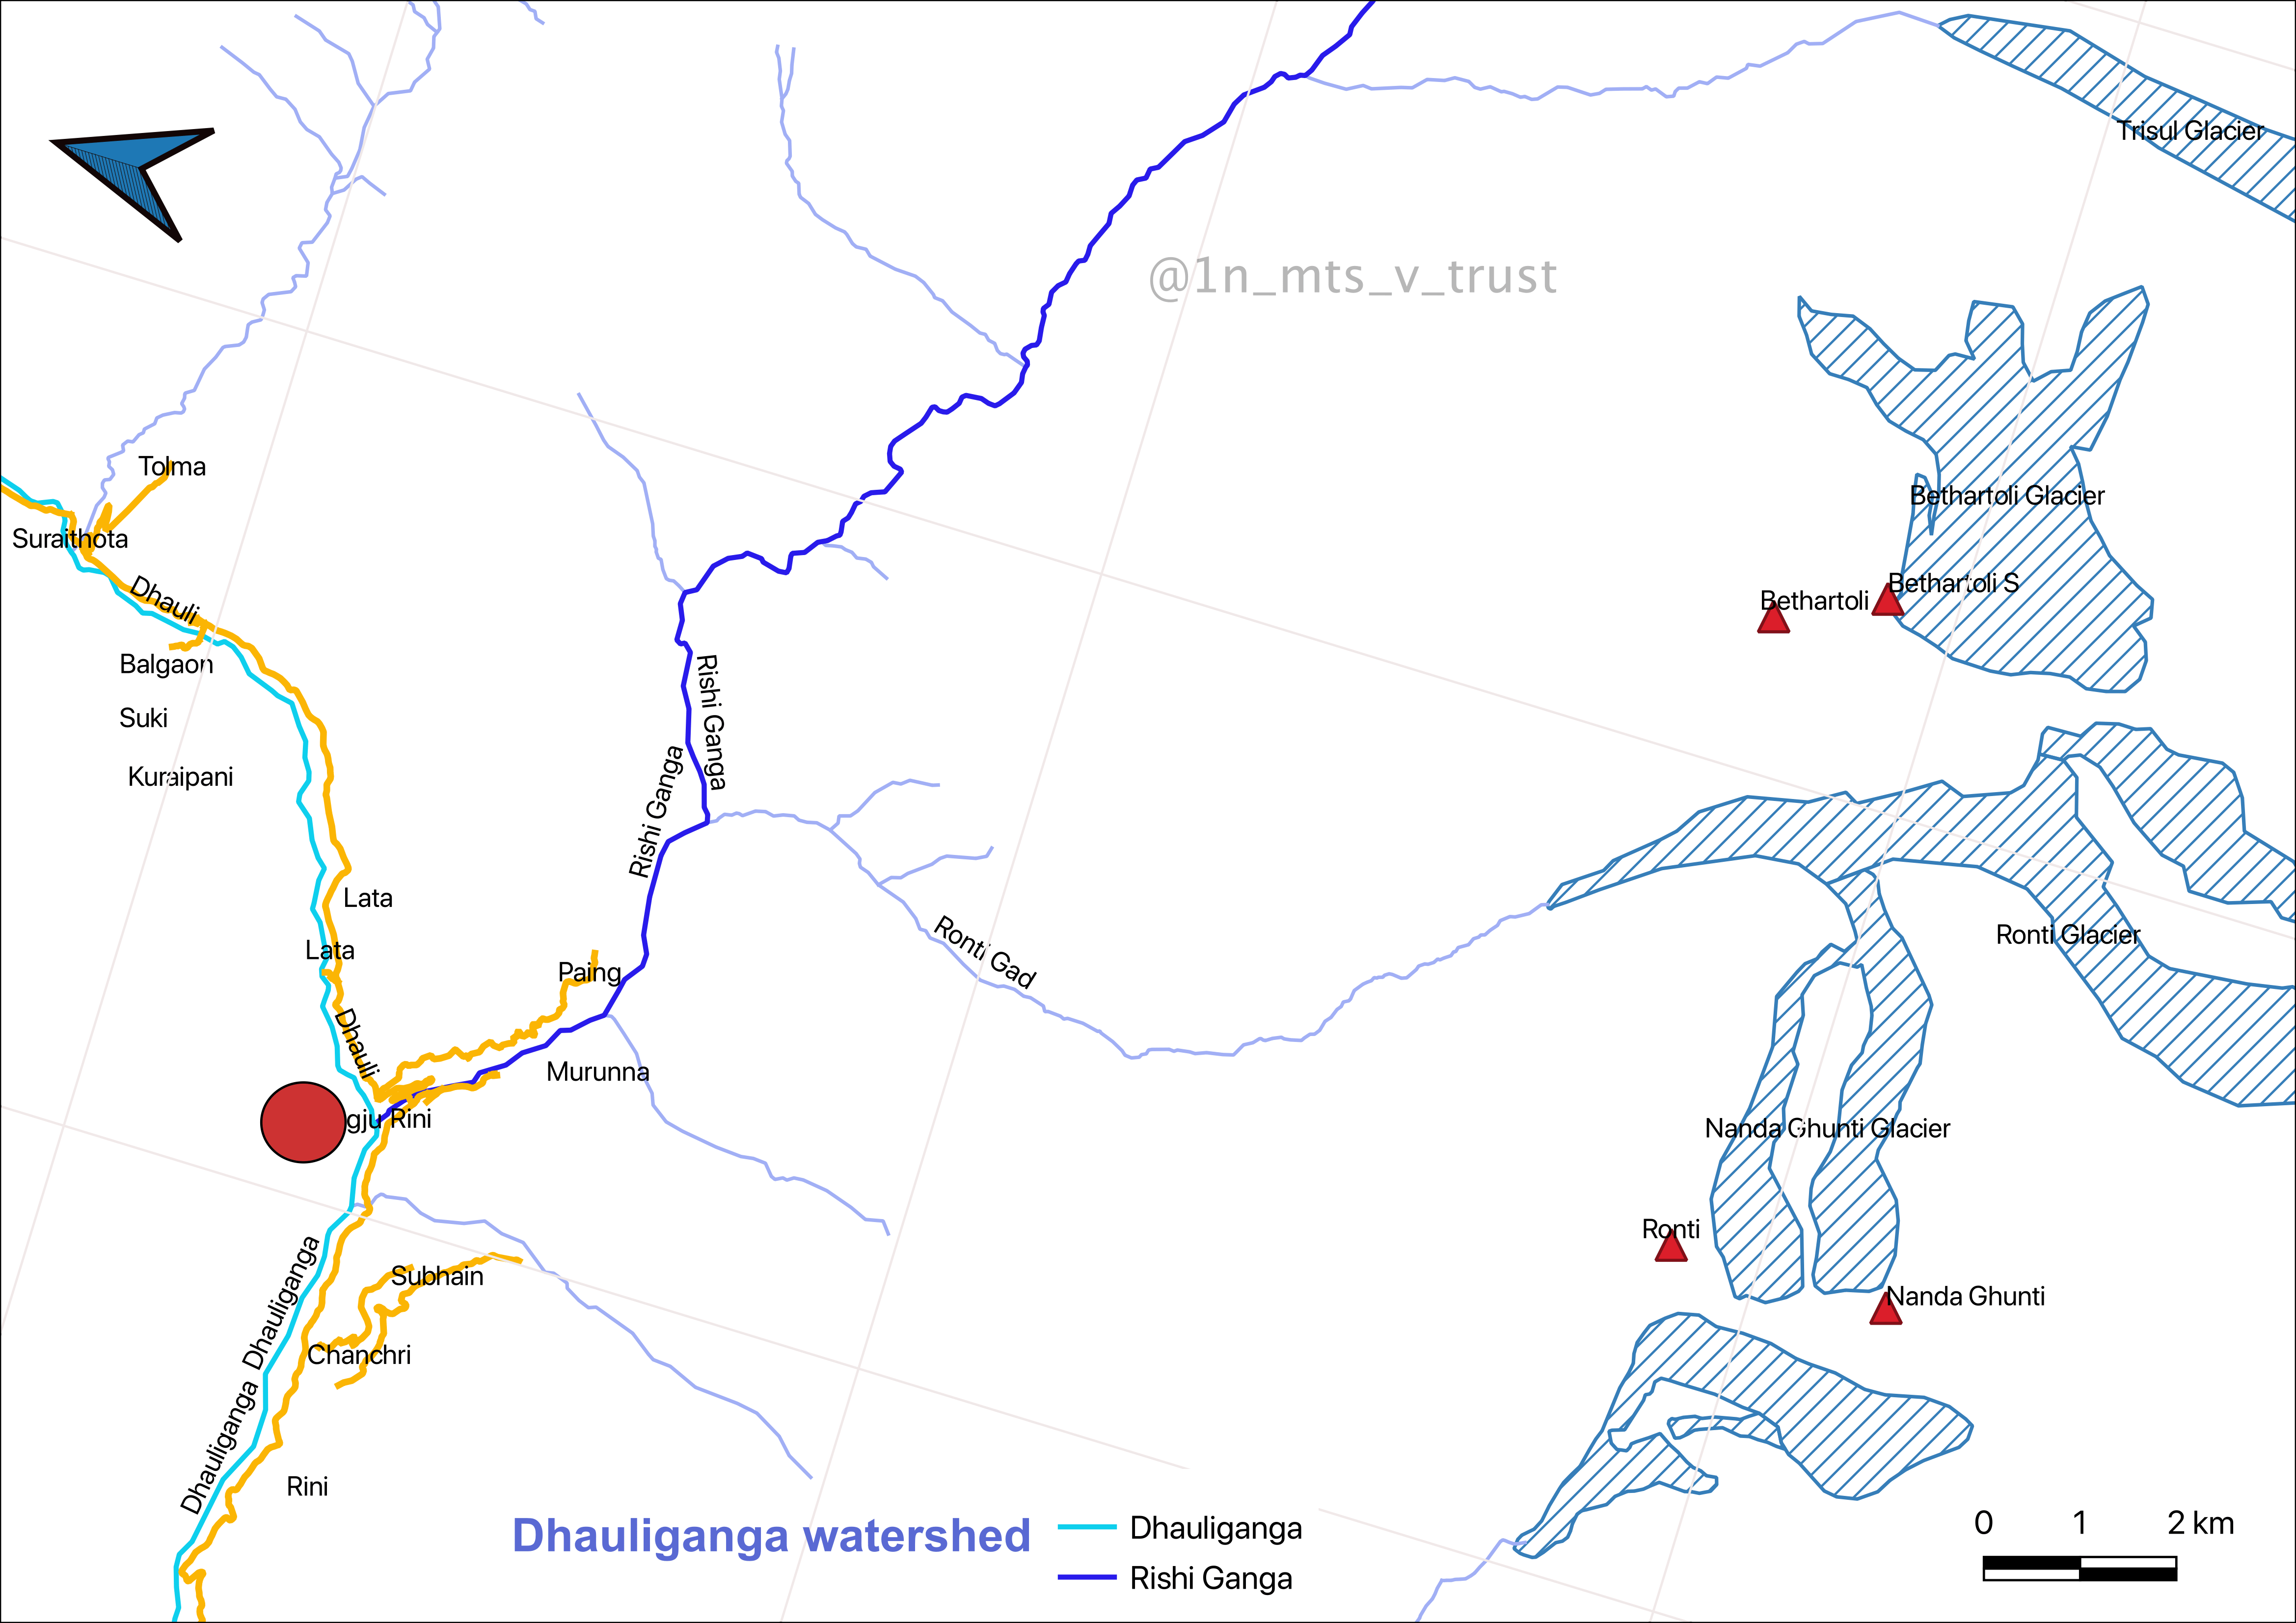
The rapidly moving avalanche caused flooding in the Ronti river first, before gathering might and flowing into the Rishi Ganga.
Dr Michalis Diakakis, a flood hazard expert and professor at University of Athens, said on Twitter that he had deduced from video and geotagged data that the flood moved 2.1 km in just about 55 seconds along the Rishi Ganga.
It looks to me that this video is shot from about 30°28'21.14"N 79°42'48.57"E (yellow pin) looking SE to SW along the Rishi Ganga. If this is the case then it moves 2.1km in 55 seconds from the right red pin to the red pin on the upper left. Pretty quickly. cc @WaterSHEDLab https://t.co/mAukRNeXvR pic.twitter.com/g02A14LHZ8
— Michalis Diakakis (@M_Diakakis) February 9, 2021
The flooded Rishi Ganga then met the Dhauli Ganga downstream at Reni, flooding the village. The Dhauli Ganga flowed further downstream to flood Tapovan.
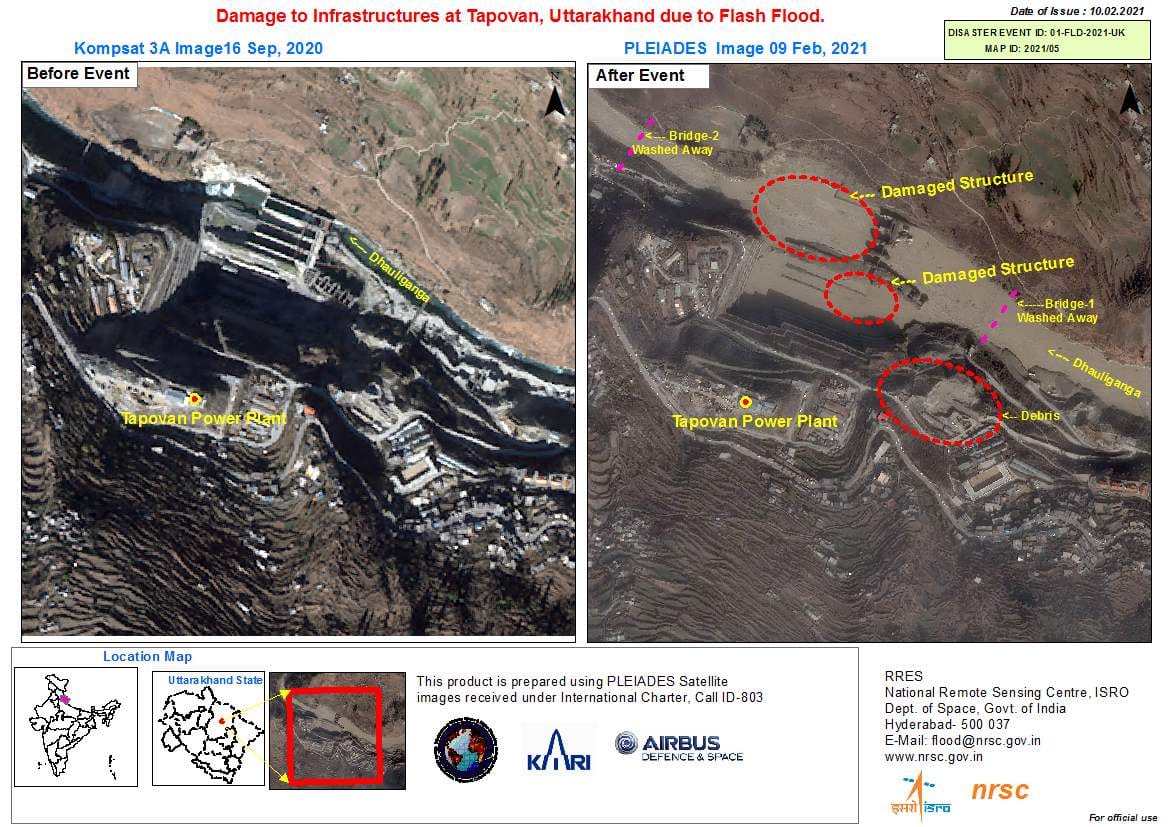
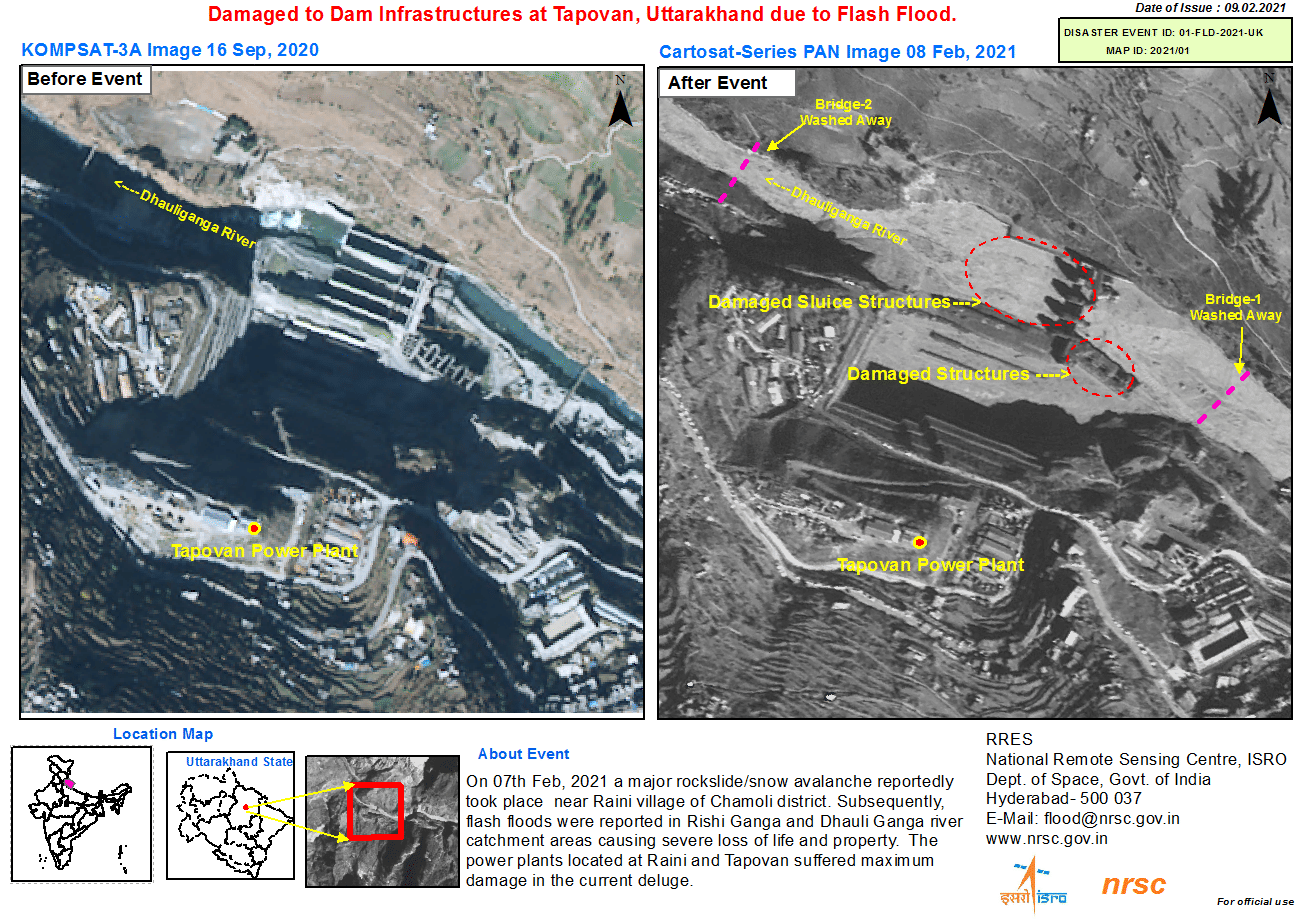
Updated satellite imagery also seeks to reveal the extent of debris deposits and damage to the settlements in the area as well as the two hydroelectric projects that fell in the path of floods and were devastated by the gushing waters.
#Sentinel2 animation with before and after (Jan 31 & Feb 10) imagery of the Tapovan Vishnugad HEP site, after the catastrophic Chamoli, India debris flow. pic.twitter.com/PBumGwxVc2
— Sotiris Valkaniotis (@SotisValkan) February 10, 2021
Images released by the National Remote Sensing Centre (NRSC), Hyderabad, from the International Charter Space and Major Disasters collaboration reveal the damage as well. Annotations in the images below — captured by satellites such as Sentinel, Resourcesat-2, KOMPSAT-3A, and Cartosat, among others — have been done by the centre.
Snowline
Glaciologist Dr Mauri Pelto, director of the North Cascades Glacier Climate Project and professor of environmental science at Nichols College in Dudley, Massachusetts, sought to identify the conditions that potentially led to the landslide by tracing the moving snowline.
The snowline is the elevation above which snow is permanently present on the ground. A rising snowline indicates loss of snow and ice.
In a blogpost on AGU, dedicated to earth and space science, Pelto said that the snowline had risen in October 2020 to 5,800-6,000m, and that snow melt had exceeded snow fall. But by January this year, the region was covered in snow, with a snowline of 4,400m. Subsequently, there was increased melting and the snowline rose to a height of 5,000m yet again due to a very warm January.
Such repeated thawing/melting and freezing of ice leads to processes like water flowing into cracks and crevasses when ice melts, and expanding again when it freezes, weakening glaciers and their structures. This could potentially have led to the rock slope detachment at the Nanda Ghunti glacier, he said, adding that deeper investigation is needed before conclusively determining what led to the landslide.
This is an updated version of the report
Also Read: How dams can help control floods — what experts said after 2013 Uttarakhand disaster
Great information collected on scientists all over the world and also our own National Remote Sensing centre peeking into this disaster just through satellite images. Our Indian scientists are also actually visiting the area hope we get enough ground images of the area too (but the area is dangerous terrain).
Good images that served to educate but it would have been super if the National Remote Sensing image had also labelled the surrounding peaks in the image.