


Let us now compare Kerala’s and Uttar Pradesh’s per capita NSDP, as shown in Figure 7.17. It shows that Kerala’s NSDP per capita growth moved ahead of Uttar Pradesh only from 1990–91. However, simply comparing the absolute figures might not be sufficient.
How Kerala and Uttar Pradesh have fared in terms of percentage changes in their per capita NSDPs is also important. The comparison of the growth rates of per capita NSDP of the two states between 1971 and 2009 is shown in Figure 7.18.


For nearly two decades following 1970–71, the two curves have similar values on the Y-axis which represents the growth rate of per capita NSDP. It is only after 1990–91 that Kerala grew at an exceptionally high rate, while Uttar Pradesh’s growth declined slightly, creating a gap that existed until 2008–09. Thus, it is relevant to see how the difference in growth rates of per capita NSDP between the two states has played out during this period, depicted in Figure 7.19.

Also read: What happens in South Block after a terror attack? Ajay Bisaria recounts post-Pulwama flurry
It can be seen from Figure 7.19 that until 1990–91 the difference in per capita NSDP growth of the two states was insignificant. In fact, in the decade ending 1980–81, the difference was negative, which would indicate that the per capita NSDP of Uttar Pradesh grew faster than Kerala’s. One may, therefore, relate the wide gap since 1991 to the economic reforms initiated by Prime Minister Narasimha Rao.
Under the new economic regime, India’s GDP growth took an upward turn, although the spurt was not uniform across states because of which economic divergence between the north and south widened considerably over the next two decades. The connection between the north’s lower economic growth and its population growth during much of the post-reform period would need further investigation.
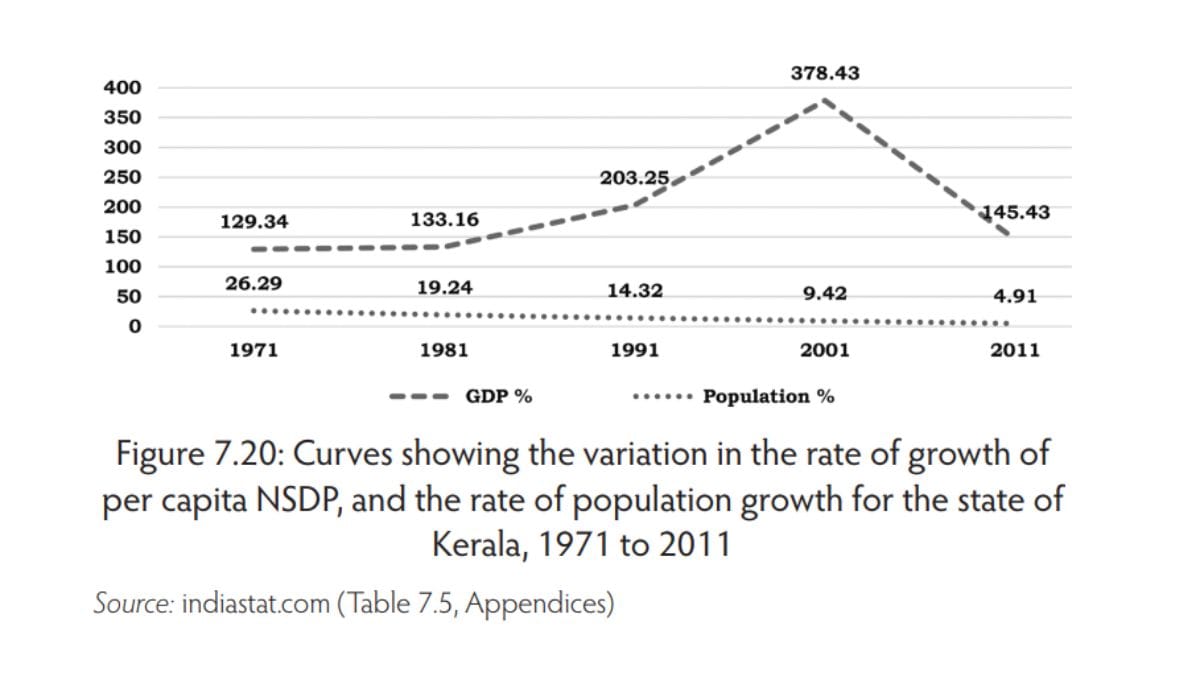
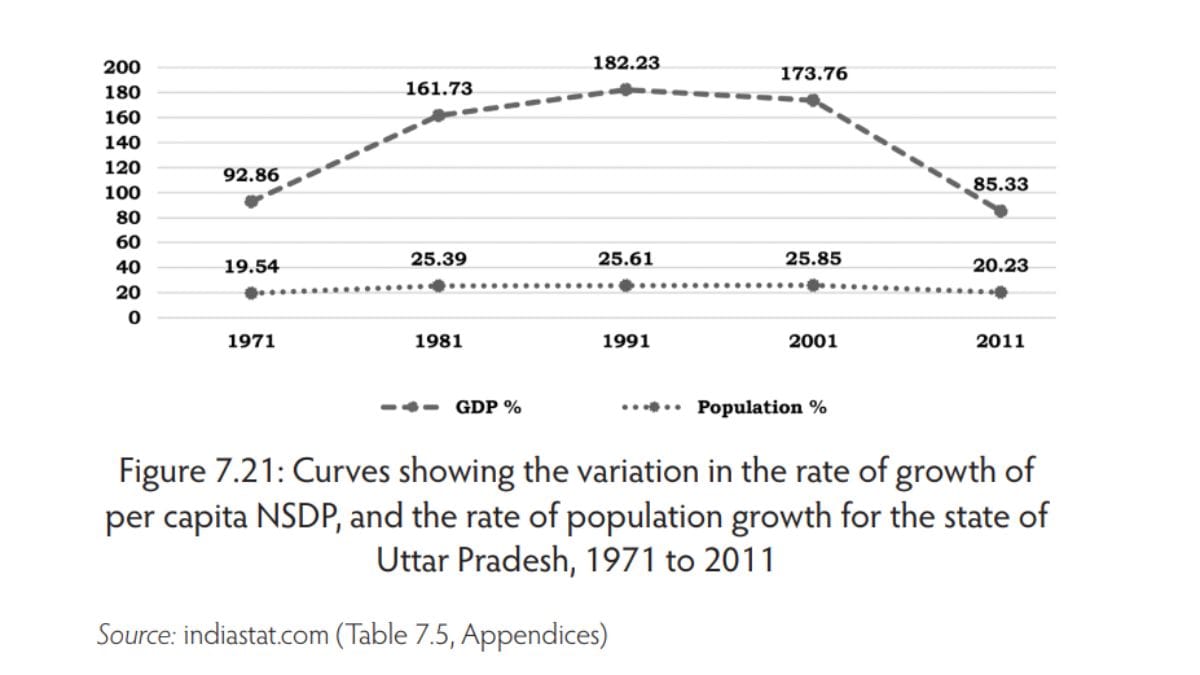
Let us also examine the relationship between the growth rates of population and per capita NSDP in Uttar Pradesh and Kerala. Presented in Figures 7.20 and 7.21 are two curves showing the variations in per capita NSDP of the two states with respect to their population growth rates.
Also read: How many partners do you need to be called polyamorous? Even zero is a valid answer
Figures 7.20 and 7.21 indicate that there is no visible association between population growth rates and per capita NSDP either for Kerala or for Uttar Pradesh. There has been a gradual decline in Kerala’s population growth rate since 1971, but its NSDP growth rate shows a rise only between 1981 and 2001, after which it declines.
Uttar Pradesh presents a more interesting case. Its population growth rate has hovered around the 20 per cent mark for all five decades, but the per capita NSDP has followed an inverted U-shaped pattern. This implies that changes in per capita NSDP in Uttar Pradesh have been accompanied by a corresponding change in population growth, although the former shows a sharper change. Thus, increase or decrease in population growth is accompanied by an increase or decrease in per capita NSDP growth. This is contrary to the general understanding of the issue.
It is frequently assumed that a fall in population growth rate should lead to a rise in per capita income growth, and vice versa. However, the example of Uttar Pradesh over 1961–71 to 2001–11 provides empirical evidence to the contrary. This suggests that the rate of population growth by itself might not be a major factor in determining per capita growth in the Indian economy. Instead, other factors such as public and private investment, foreign direct investment (FDI), industrialisation and infrastructure development are required for rapid GDP growth and increasing per capita incomes.
It is widely accepted that, other things being equal, an economy has a much higher chance of rapid GDP growth in the initial stages of decline in population growth experienced around the end of the second or the beginning of the third stage of demographic transition. During this period, the youth dependency ratio goes down and participation in Figure 7.21 Curves showing the variation in the rate of growth of per capita NSDP, and the rate of population growth for the state of labour force goes up. This is because the proportion of dependents, mostly children, to the total population starts going down.
A high dependency ratio, especially one marked by a large proportion of children, not only means a reduced proportion of working people, but also forces public and private investment to be channelised in such a way that over the short-to-medium term, it becomes less productive in terms of GDP as well as per capita income growth.
Conversely, a fall in the youth dependency ratio brings about a corresponding rise in the proportion of the working-age population, creating a ‘demographic dividend’ that provides a golden opportunity for rapid growth in GDP and per capita incomes usually for a few decades. However, other enabling factors, such as education, health, infrastructure, investment, employment opportunities and openness to international trade, are required to take full advantage of this demographic dividend. There is no linear relationship between phases of population growth and economic growth either in India or in other countries.
 This excerpt from Ravi K Mishra’s ‘Demography, Representation Delimitation: The North-South Divide in India’ has been published with permission from Westland Books.