A good thing about credible and dynamic data on various policy metrics is that it informs about the current state of affairs of the economy and via a time-series comparison, it helps establish its trajectory. In case of data on farmer incomes too, with the results of the recently released Situation Assessment Survey (SAS) of NSSO, there are now three data points for comparison over time — 2002-03, 2012-13 and 2018-19. In a recent article, we undertook a quick analysis of the results from SAS 2018-19. Here, we build on that and start by offering a clarification on farmer income estimates that be used for comparison between years.
Also read: Meghalaya farmer is now richer than Punjab’s
Comparing between years…
Overtime, the NSSO tries to improve its assessment methodology under its various surveys. In 2002-03, while only the landowner farmers were studied, this condition was done away with in its 2012-13 assessment, making the two estimates not strictly comparable. In its 2018-19 survey too, many such improvements were undertaken, among them were: (i) addition of a new source of farmer income i.e., ‘income from leasing out land’; and (ii) ‘an assessment of pensions and remittances received by the farmer household’. While the latter is not included into the estimate of monthly income, the former is. In other words, for 2018-19 (NSSO’s 77th round), ‘income from leasing out land’ was included in the estimates of income of the agricultural households but in the 2012-13 SAS (NSSO’s 70th round), this head of income was not recorded, again making the two estimates not strictly comparable. To make the two estimates comparable, we need to remove the ‘income earned from leasing of land’ from the 2018-19 estimate.
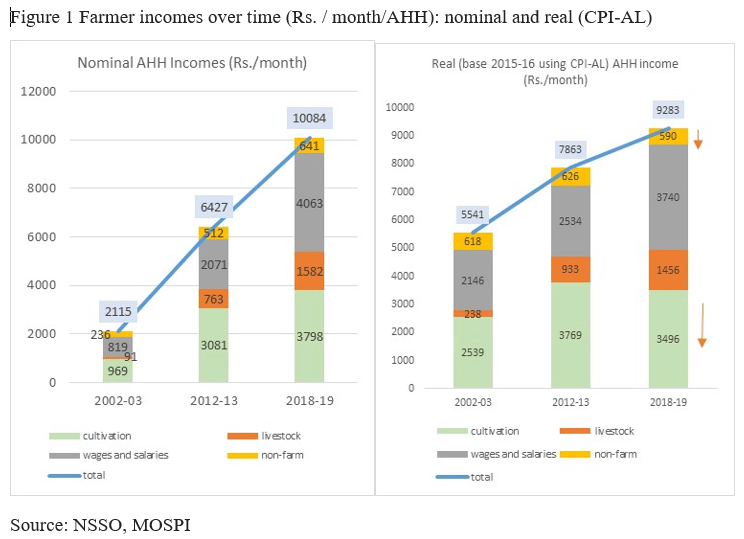
In 2018-19, an average Indian agricultural household (AHH) earned about Rs 10,218 per month and of this, Rs 134 was the income earned from leasing of land. By removing this income from Rs 10,218, we get Rs 10,084 and this makes the 2018-19 SAS estimate of income comparable with the 2012-13 SAS estimate. In 2012-13, an AHH earned about Rs 6,427 and from similar sources of income, in 2018-19, they earned about Rs 10,084, implying a nominal growth rate of about 7.8 per cent and a real growth rate (base 2015-16 using CPI-AL (agricultural labourers) of about 2.8 per cent (or about 5.9 per cent if deflated using WPI data with base 2011-12) (Figure 1).

In real terms (base 2015-16 using CPI-AL), it appears that not just income from cultivation but also the income from non-farm activities (after adjustment for leasing income) have fallen between 2012-13 and 2018-19 (RHS Figure 1). From about Rs 3,770, the real monthly income from cultivation has fallen to less than Rs 3,500 per month. Income from non-farm activities has also fallen from Rs 626 per month to Rs 590 per month in real terms. This implies that a farmer family supported itself in the year essentially through its livestock incomes and by working on others’ farm or under MGNREGA and through other similar activities. If it were only for cultivation, a farmer would have seen depletion of his real income.
Income from leasing-out land was not as significant for many states but for agricultural households in Punjab and Haryana, for example, its monthly contribution equalled about Rs 2,652 and about Rs 621 respectively. The AHH in Arunachal Pradesh appear to have earned nothing from this source.
Also read: Covid meant high protein intake but chicken, eggs, oil, all acting pricey. Govt must intervene
Slower growth rate in farm incomes
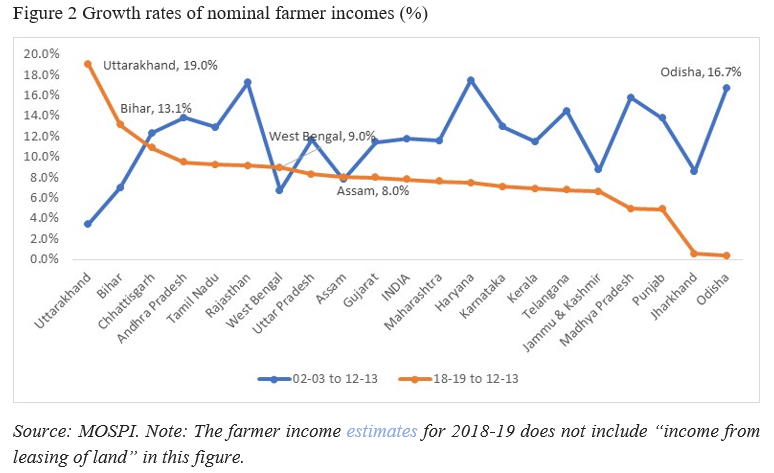
In most Indian states, the compound annual growth rate (CAGR) of farm income has slowed down between the two surveys in 2012-13 and 2018-19 (in Figure 2, the yellow line is below the blue line in most cases). The exception includes Uttarakhand, Bihar, West Bengal and Assam that have registered much higher growth rates between 2012-13 and 2018-19 than between 2002-03 and 2012-13.

Farmers’ income in Odisha and Jharkhand had grown exceptionally fast between 2002-03 and 2012-13, but post 2012-13, they have registered the slowest growth (Figure 2). Incomes in Punjab and Madhya Pradesh, despite high procurement of food grains at minimum support price (MSP), have registered a slower growth rate between 2012-13 and 2018-19. Chhattisgarh has, however, been able to maintain double-digit growth rates in both the periods.
In terms of sources of income, Bihar saw exceptional double-digit growth rates (between 2012-13 and 2018-19) in all three income sources: livestock activities (36 per cent CAGR), non-farm activities (12.2 per cent CAGR) and wages and salaries (11.2 per cent CAGR). Its income from cultivation also grew by about 8 per cent. In case of Odisha, income from livestock activities, which grew the fastest (55 per cent CAGR) between 2002-03 (Rs.16) and 2012-13 (Rs.1314), fell by about 17.4 percent CAGR between 2012-13 (Rs.1314) and 2018-19 (Rs.416). In fact, Odisha’s income from non-farm sources also contracted in the latter period. Its income from cultivation grew only marginally (at 1.8 per cent CAGR) in this period. The story of Jharkhand is similar, except that its income from cultivation too fell in the latter period. To draw lessons, one needs further explanation and a deeper analysis.
There are other interesting facts that need further probing, like (i) a Punjab and Haryana farmer makes more money through their livestock activities than an average Gujarati farmer who is known to benefit from a seamless White revolution, (ii) a farmer earns more from wages in Jharkhand than in Bihar, (iii) a Punjab farmer makes more income by leasing out land than a West Bengal or a Tamil Nadu farmer makes from cultivating crops. These findings only show how diverse and complicated agriculture is and why our Constitution-makers placed agriculture in the state list. An important learning from SAS 2019 is that the policies based on agro-ecology are best made when they are tailored to a state. This includes the policies on cropping patterns.
Also read: Indian farmers need a new distress index. Just suicide data won’t do
2018-19 income could be much higher…
If one did not have to undertake a historical comparison of the 2018-19 estimate of the farmer incomes, then the survey-improvement initiatives undertaken by NSSO under SAS 2018-19 can help us in making a more realistic and credible estimate of income of an average farmer household. Using the SAS 2018-19 data, we can see that an average Indian AHH has following sources of income:
- Income s/he makes from cultivation activities: Rs 3,798 per month;
- Income from livestock activities: Rs 1,582 per month;
- Income s/he makes from wages and salaries: Rs 4,063 per month,
- Income s/he makes from non-farm activities: Rs 641 per month
- Income from leasing out land: Rs 134 per month; and
- Earnings of the household from pensions and remittances: Rs 611 per month
All this makes the total earnings of an agricultural household to be about Rs 10,829 per month.
In addition to this, SAS 2018-19 has not reported the income received by farmers under the PM’s Kisan Samman Nidhi scheme. From 1 December 2018 to 31 March 2019, 4.74 crore landholder farmers were registered under the scheme. Out of these, 4.22 crore had received the first instalment while 4.02 crore had received the second instalment. All this implies that the average income of the farmer may be much higher.
Nevertheless, there is a clear word of caution. These numbers are national or state averages, and they camouflage huge and often discerning variations and volatility in incomes between states and within districts or even villages. And the state-wise analysis given in this article is in nominal terms i.e., it still has not taken into account the impact of inflation on the incomes. In the absence of indexation of any sort, with close to 5 per cent inflation at the retail level, most farmers are likely to have faced an erosion of their real incomes since 2012-13.
Shweta Saini is a Senior Visiting Fellow at Indian Council for International Economic Relations (ICRIER). Siraj Hussain is retired Union Agriculture Secretary and Visiting Senior Fellow at ICRIER. Views are personal.
(Edited by Anurag Chaubey)


