


Tax breaks in India have been influential in driving saving into specific products, like insurance and pensions.
Indian households tend to hold a high fraction of their wealth in non-financial assets such as real estate and gold. Tax policy has been used to incentivise saving in financial assets and encouraging long-term saving. Analysing aggregate national accounts data, this article finds that while aggregate financial saving has remained stable, tax breaks have been influential in driving saving into specific products, like insurance and pensions.
As the budget session approaches, there is clamour for increasing the tax incentives available to the ‘middle class’. Research, however, shows that tax incentives have played a limited role in increasing financial saving, and at best, have led to substitution towards tax-incentivised financial assets (Ochmann 2014, Chetty et al. 2014, Das-Gupta 1990). Given an already low tax base in India, the government should evaluate the benefits of tax breaks vis-à-vis the costs of revenue forgone as well as distortions in the market that get created, before announcing measures in the upcoming budget.
Indian households tend to hold a high fraction of their wealth in non-financial assets such as real estate and gold. Tax policy has been used as a lever in India for incentivising saving in financial assets as well as encouraging saving for the long term. This is done through tax breaks for specified financial products such as fixed deposits, small saving instruments, pension and provident funds, and insurance, through Section 80C of the Income Tax Code.
Have the tax incentives had any effect on financial saving? International evidence broadly suggests that tax breaks of specific financial products only lead to a substitution effect – households shift investments to those assets that qualify for a tax break. Several direct tax committees such as the Shome Committee in 2001, the Kelkar Committee in 2002, the Malegam Committee in 2015, have raised similar concerns about the structure of tax breaks in India.
In recent research (Pandey et al. 2018), we look at aggregate national accounts data to study if financial saving had changed with tax breaks.
Overall financial saving of households in India
Figure 1 shows the time series of household investment in financial assets (representing financial saving) as a percent of GDP (gross domestic product). The solid line shows the series using data from the 2004-05 base year, while the dashed line shows the data using the 2011-12 base year series.
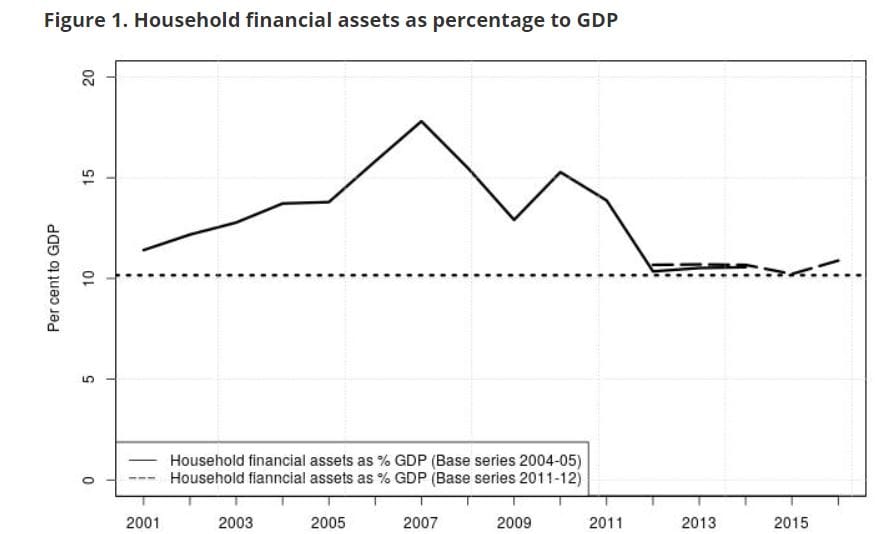
We find that financial saving had been rising steadily from about 11% of GDP in 2001 to a high of about 17% in March 2007. The years between 2003 and 2005 did not see any tax breaks, and yet there was a rise in financial saving. Since 2007 there has been a tax break announced pretty much every year. And yet, financial saving had fallen to about 11% of GDP by March 2013. When one looks at the new series, the conclusion remains the same. Financial saving as percent to GDP remained roughly constant through the tax breaks of 2012 to 2015 and increased only slightly as of March 2016, which may be because of the increase in the overall limit of tax exemption from Rs.100,000 to Rs.150,000 in the 2014-15 budget. The association between tax breaks and financial saving appears weak.
Composition of household financial saving
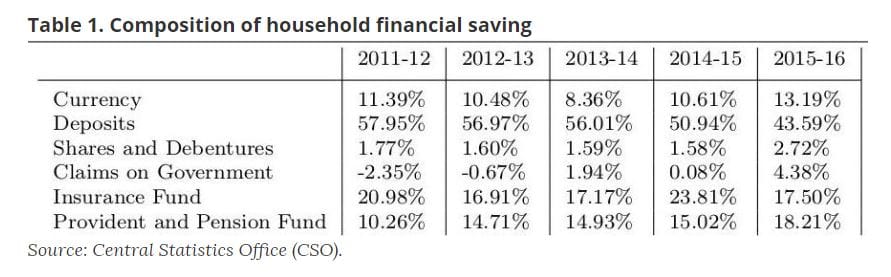
If one looks at the share of various saving instruments in the overall household financial saving, we find that bank deposits constitute the bulk of household financial saving, though its share in the overall household financial saving has seen a dip from 2011-12 onwards (See Table 1). Investments in provident and pension funds have seen a gradual rise, though they still constitute a small proportion of the overall saving.
We study household portfolios for the financial year 2016-17 using the CMIE (Centre for Monitoring Indian Economy) Consumer Pyramids household survey. This allows us to compare households that fall under the tax bracket with households that do not. We find a big difference in those households that are taxed versus those that are not taxed (Table 2).
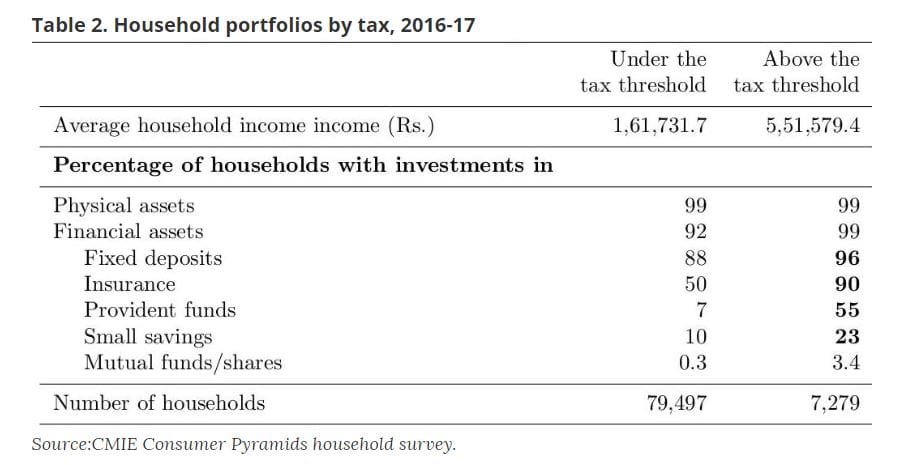
In 2016-17, a much larger proportion of taxed-households claim to have outstanding investments in fixed deposits, insurance, small savings, and pensions – all of which are instruments covered under Section 80C. For example, 88% of households that are not taxed claim to have outstanding investments in fixed deposits, as opposed to 96% of taxed households. The next instrument of choice is insurance with 50% of non-taxed households having insurance, as opposed to 90% of taxed households; followed by provident/pension funds where the difference is much starker – 7% of non-taxed households as opposed to 55% of taxed households.
Tax breaks and financial saving
One could argue that this is purely an income effect, and not a tax effect. Those in the tax bracket are also those with higher incomes and would have saved in these products anyway. We therefore look at households with the same total income but different tax status. We only consider those in the salaried class, as there is less of an ambiguity over the tax liability of these households, and because of TDS (Tax Deducted at Source), we see the highest compliance. We also only consider those households with income over Rs. 250,000 as this is where the incentives will begin to matter. There may be households whose income is above the threshold but no individual member may have an income higher than the threshold. Such a household would not qualify as a taxed household.
Our analysis shows that tax-incentivised households invest in the products that are given a tax break, especially insurance, and this impact is highest for households in the income tax bracket of Rs. 350,000 to Rs. 500,000 (Table 3).
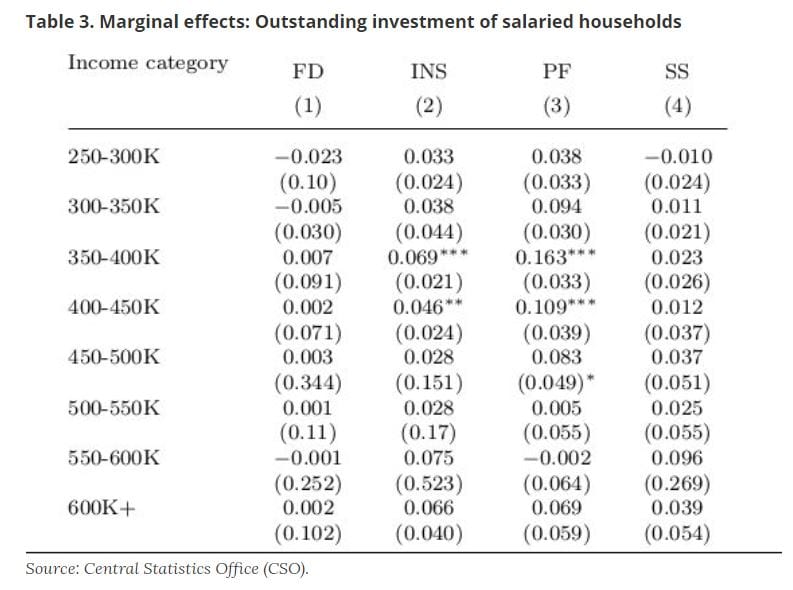
Those who fall under the tax bracket in the Rs. 350,000 – Rs. 400,000 income category are almost 7% more likely to have invested in insurance relative to those who do not fall under the tax bracket. Those taxed in the Rs. 400,000 – Rs. 450,000 income category are 5% more likely to have invested in insurance.
Conclusion
Thus, while the aggregate financial saving has remained stable, tax breaks have been influential in driving saving into specific products, such as insurance and pensions. These considerations should influence the design of tax policy.
Radhika Pandey is a consultant with the macro-finance group at the National Institute of Public Finance and Policy (NIPFP).
Ila Patnaik is a professor at the National Institute of Public Finance and Policy (NIPFP).
Renuka Sane is an associate professor at the National Institute of Public Finance and Policy (NIPFP).
This article was first published in Ideas for India. Read the full article here.