


New Delhi: The post-liberalisation period saw India’s southern states accelerate their economic growth and contribution to the overall country, while states such as Uttar Pradesh, Bihar, and West Bengal have languished, according to the findings of a new paper.
The working paper—published Tuesday by the Economic Advisory Council to the Prime Minister (EAC-PM) and authored by EAC-PM member Sanjeev Sanyal and joint director Aakanksha Arora—has analysed the gross state domestic products (GSDPs) of each state and their relative contributions to the national gross domestic product (GDP) over the period 1960-61 to 2023-24.
It has also looked at the changes in the relative per capita GSDPs over this period.
According to both metrics, the analysis shows wide disparity across Indian states, but does point to several regional trends that have emerged.
One major trend is the increasing and sustained economic significance of the southern states, and the relative decline of once-dominant states like Uttar Pradesh and Bihar. The second is the divergence in the performance of neighbour states, such as Punjab and Haryana, and West Bengal and Odisha.
The ‘national GDP’ metric used in this paper is the total of the states’ GDPs, rather than the GDP figure for the whole country. The reason for this is because the earlier years of the analysis showed significant discrepancies between the national GDP and the sums of the state GDPs. The sum of the state GDPs was used to ensure compatibility over time.
The other important methodological factor to keep in mind is that the per capita income of the states as measured in the paper is actually the per capita Net State Domestic Product (NSDP), since the data on the actual per capita incomes was not available for earlier years.
“These are different to the extent that the income received as remittances (domestic or international) will not be accounted for in the recipient state,” the paper acknowledged. “We do understand that it will may (sic) make some difference for states like Kerala, Uttar Pradesh and Bihar.”
Also read: Don’t be surprised with a PM gift before elections. That’s how fuel prices are manipulated
Liberalisation unlocked the southern states
The paper notes that, before 1991—the year the economy was substantially liberalised—the southern states did not outperform to any great degree. For example, Andhra Pradesh’s contribution to the national GDP stood at 7.7 percent in 1960-61, which remained level for the next 30 years, coming in at 7.6 percent in 1990-91.
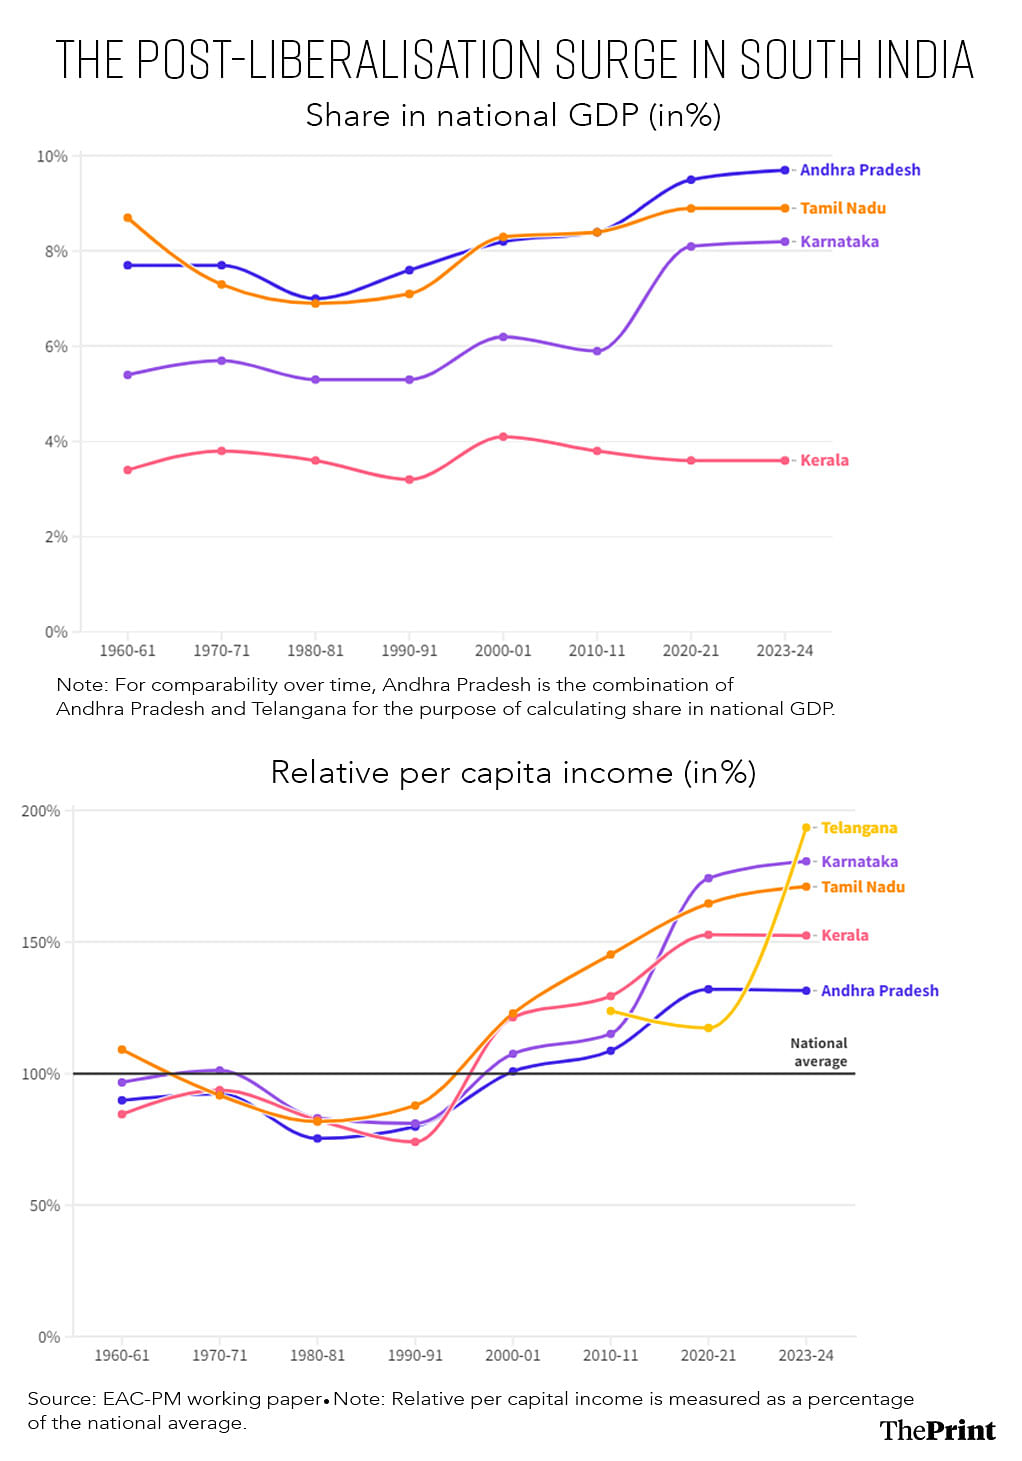
Similarly, Karnataka’s contribution went from 5.4 percent to 5.3 percent over the same period, Kerala’s from 3.4 percent to 3.2 percent. Tamil Nadu, notably, saw a relative sharp fall in its contribution to national GDP—from 8.7 percent in 1960-61 to 7.1 percent in 1990-91.
“However, since the economic liberalisation of 1991, the southern states have emerged as the leading performers,” the paper noted.
The data back up this assertion clearly. Within a decade, by 2000-01, Andhra Pradesh’s contribution to national GDP had shot up to 8.2 percent, Karnataka’s to 6.2 percent, Kerala’s to 4.1 percent, and Tamil Nadu’s to 8.3 percent.
And this strong growth continued.
“In 2023-24, Karnataka, Andhra Pradesh, Telangana, Kerala and Tamil Nadu together accounted for approximately 30 percent of India’s GDP,” the paper said. “In addition, per capita income of all southern states became higher than the national average after 1991.”
This strong performance has also translated into a robust growth in the relative per capita incomes of the residents of these states. For example, the per capita income levels in all of the southern states—except in Tamil Nadu—was lower than the national average in 1960-61 to 1990-91.
Even in Tamil Nadu, the per capita income level was 109 percent of the national average in 1960-61, but fell swiftly to about 88 percent by 1990-91. In other words, it fell from 1.09 times the national average to 0.88 times.
Since then, however, the growth of per capita income has been remarkable in these states.
“The relative per capita income in Telangana is now 193.6 percent of the national average, while Karnataka, Tamil Nadu, and Kerala have per capita incomes 181 percent, 171 percent, and 152.5 percent of the national average, respectively,” the paper said.
UP & Bihar—from powerhouses to laggards
“In the 1960s, Uttar Pradesh (then undivided) was the largest economic powerhouse in the country, contributing 14.4 percent of India’s total GDP,” the paper noted. “It is fascinating to note that the state of Bihar (also then undivided) had the fifth highest share in India’s GDP (7.8 percent) in early 1960s, higher than that of even Gujarat, Karnataka, etc.”
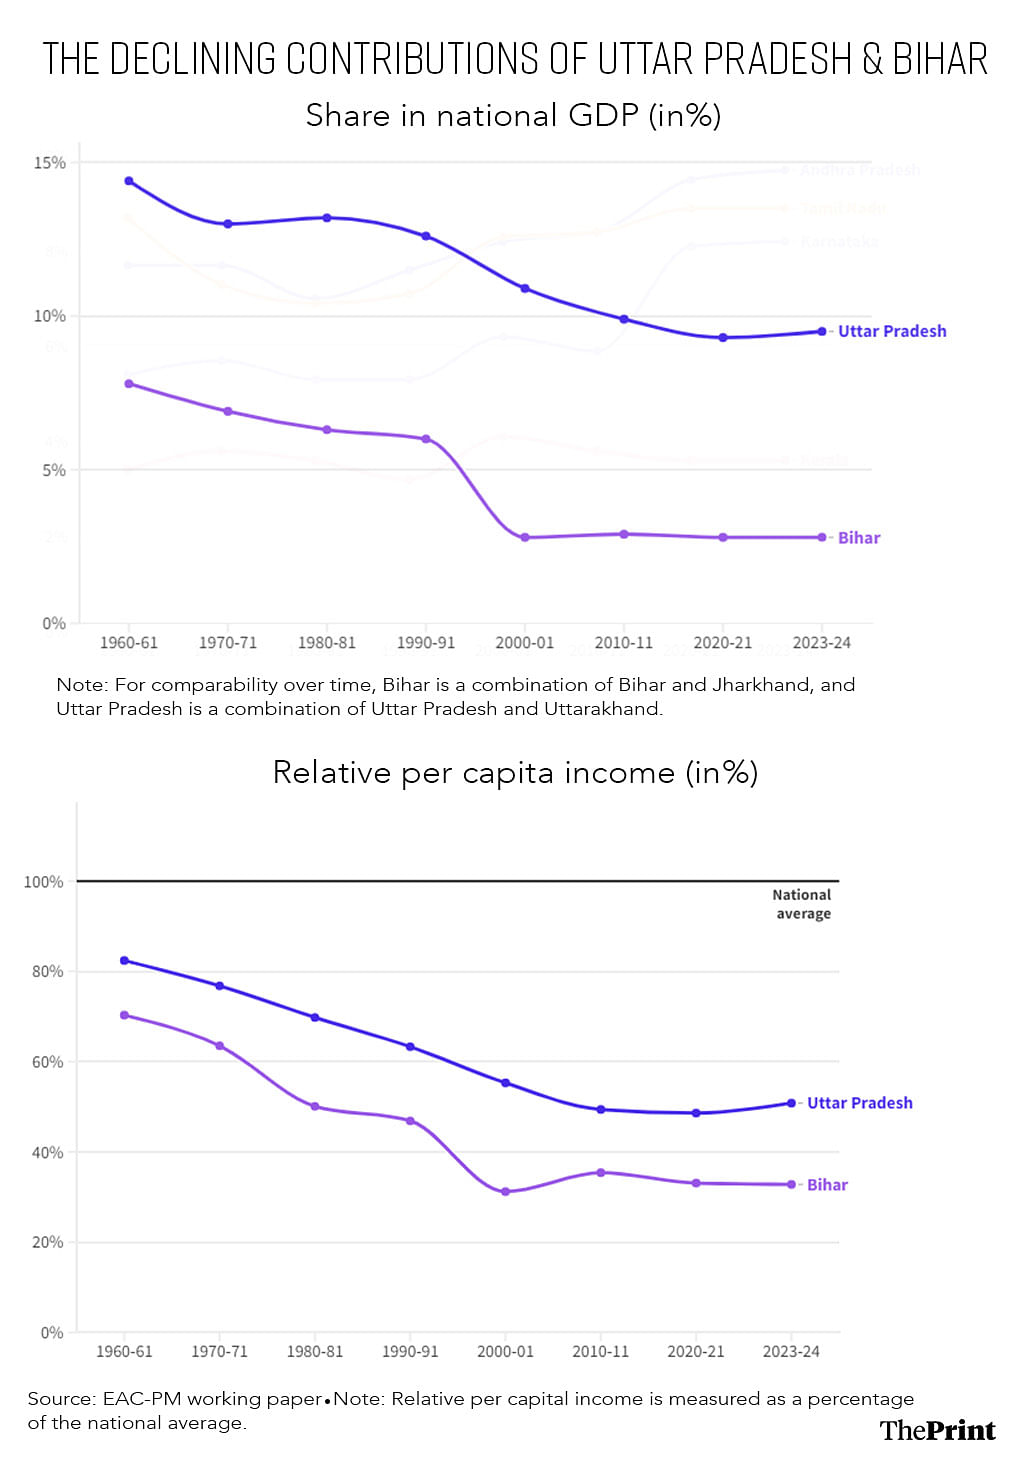
These rankings remained largely the same as of 1990-91 as well, with Uttar Pradesh’s 12.6 percent contribution still the highest of all states, and Bihar’s 6 percent contribution placing it at the seventh rank.
However, since then, as these two states saw their contributions to national GDP continue to decline, and the southern states started increasing their shares, Uttar Pradesh and Bihar began to fall in the rankings.
Here, Uttar Pradesh performed relatively better than Bihar. UP’s share in the country’s GDP stood at 8.4 percent in 2023-24, the fourth highest among all states. However, this is post the bifurcation of the state. Once Uttarakhand’s share is added, then the unified UP’s contribution stood at 9.5 percent, the third highest.
What is also noteworthy is that the data for 2023-24 for UP, both on a bifurcated and unified basis, breaks a more than 60-year trend of falling contributions. That is, the state’s contribution to national GDP fell consistently between 1960-61 and 2020-21. The data for 2023-24 marks the first rise in the state’s contribution during the period being measured.
Bihar’s contributions to the national GDP grew in the 2000-10 decade to 4.8 percent (undivided), but fell subsequently to 4.3 percent, where it has stayed. This trend has remained the same even considering a post-bifurcation Bihar.
These changes become much starker when looking at per capita income. Bihar’s per capita income was 70.3 percent of the national average in 1960-61. It now stands at just 32.8 percent, or one-third, as of 2023-24. Looked at another way, the state’s relative per capita income has more than halved during this period.
For UP, the relative per capita income has fallen from 82.4 percent in 1960-61 to 50.8 percent as of 2023-24. That is, the average UP resident earns about half of what the average Indian earns.
Neighbours, but with a growing divergence
“An interesting observation is the divergent economic trajectories of the neighbouring states of Punjab and Haryana, which were originally part of the same state,” the working paper noted.
The same trend can be seen with West Bengal and Odisha.
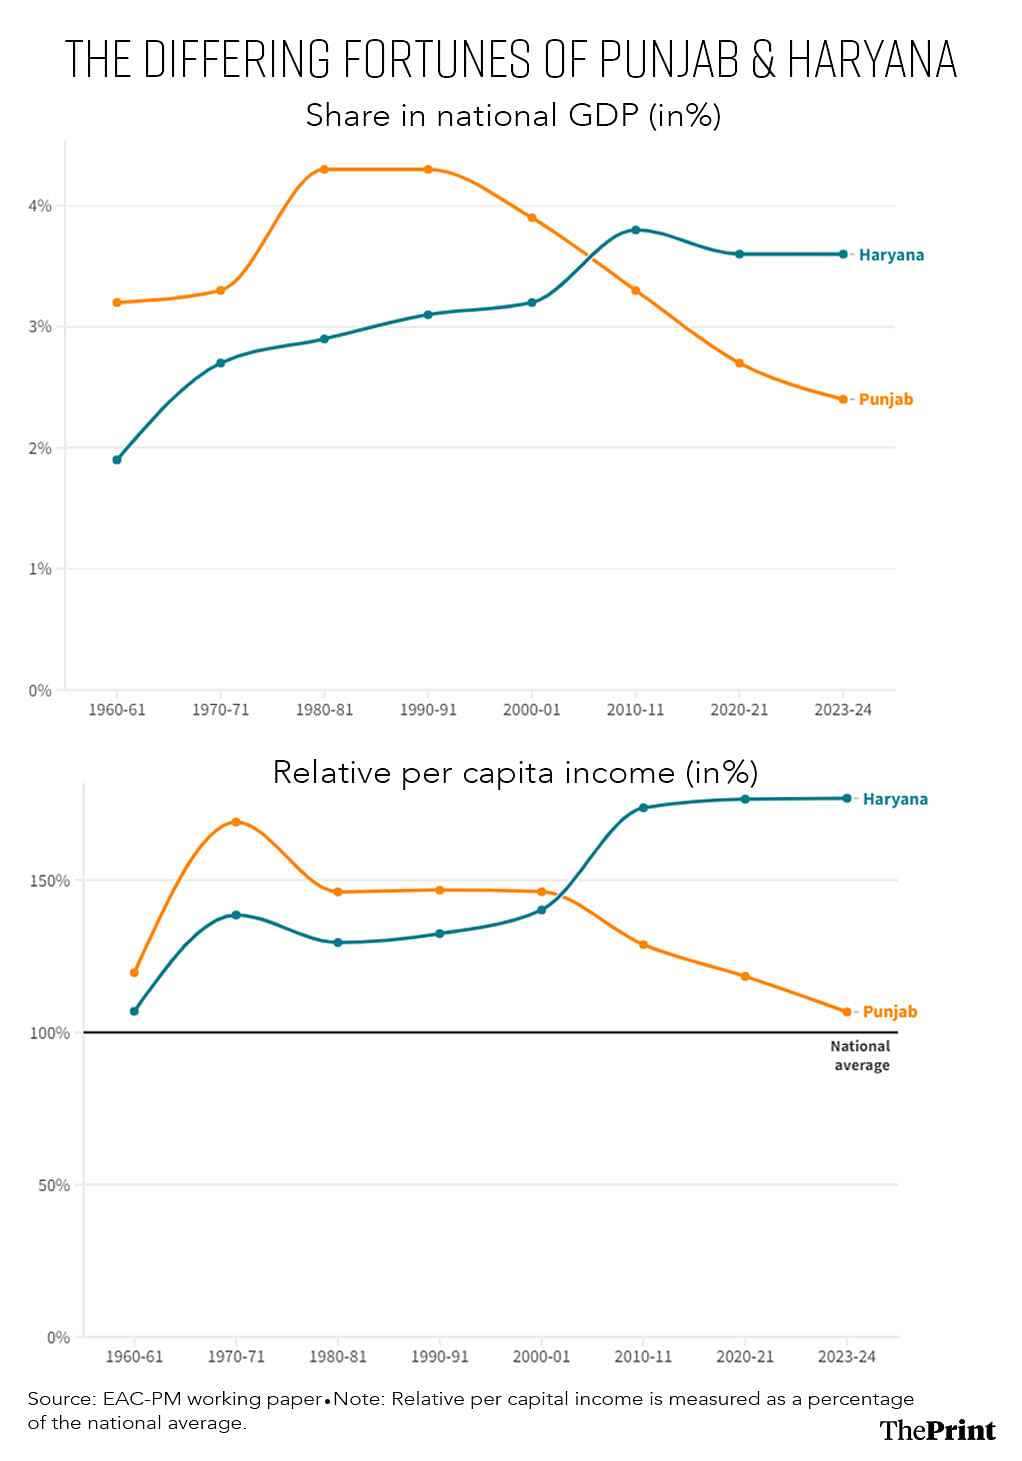
In 1960-61, Punjab’s share of India’s GDP was 3.2 percent, while Haryana’s was 1.9 percent.
“Following the Green Revolution, both states experienced a boom in agriculture, leading to increases in their shares,” the paper added. “Punjab’s share rose to 4.4 percent and Haryana’s to 2.7 percent by 1970-71.”
Following this period, however, is when the divergence began. Punjab’s share plateaued around 4.3-4.4 percent over the next two decades and began to decline from 1990-91 onwards, reaching 2.4 percent in 2023-24.
In contrast, Haryana’s share continued to increase even after 1970, rising to 3.8 percent by 2010-11. Since then, it has remained stable at 3.6 percent.
“It is likely that the success of Gurugram accounts for some part of Haryana’s increasing share,” the paper notes.
The Green Revolution also saw a rapid increase in the per capita incomes of Punjab and Haryana. However, the two states began to soon diverge here too.
Punjab’s relative per capita income rose from 119.6 percent of the national average in 1960-61 to 169 percent in 1970-71, but then declined to 146.1 percent by 1980-81. It then remained relatively stable at these levels until 2000-01, after which it began to decrease again.
Notably, the per capita income of Punjab was 106.7 percent of national average in 2023-24, even lower than what it was in 1960-61.
In contrast, Haryana saw its relative per capita income increase from 106.9 percent in 1960-61 to 138.5 percent in 1970-71—thanks again to the Green Revolution—and then remain at similar levels until 1990-91.
“However, post-economic liberalisation, Haryana’s relative per capita income began to rise rapidly, reaching 176.8 percent in 2023-24,” the paper said. “Today, Haryana has the fourth-highest relative per capita income among major states, following Delhi, Telangana, and Karnataka.”
The other two neighbours that have seen diverging growth paths are West Bengal and Odisha. West Bengal held the third-largest share of national GDP at 10.5 percent in 1960-61, but has seen a consistent decline since then, and now accounts for only 5.6 percent as of 2023-24.
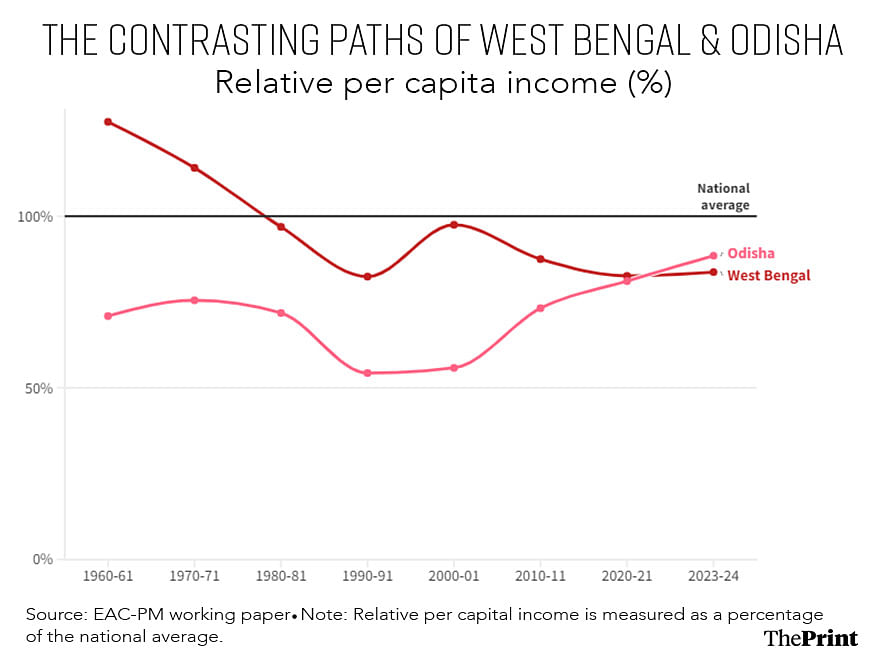
Similarly, Bengal’s relative per capita income was 127.5 percent of the national average in 1960-61, but has since fallen to 83.7 percent in 2023-24, below that of even “traditionally laggard” states like Rajasthan and Odisha, the paper said.
Odisha, on the other hand, has seen a significant turnaround, at least in terms of its relative per capita income. While it saw a consistent decline in terms of relative per capita income from 1960s to 1990-91—from 70.9 percent to 54.3 percent—it subsequently saw a strong increase, reaching 88.5 percent in 2023-24.
“As it stands today, per capita income of West Bengal is even lower than that of Odisha,” the paper highlighted.
(Edited by Zinnia Ray Chaudhuri)
Also read: Five debt defaults, two NPAs & 100% value erosion. MTNL barrels towards a major financial crisis
It’s only a matter of time for the freebies and debts to stall the growth engines of Andhra and Karnataka.