

The average of all the positive changes in the vote shares of the Congress party, 1957-2014, is four ppt. All the negative changes average 5.5 ppt. The highest swing, 8.2 ppt in 1980. The largest decline, 9.3 ppt in 2014, almost identically equal to the 1977 debacle. There is a reasonable likelihood that the 2014 vote share was exceptionally low—hence, a maximum 7.5 per cent swing assumption is possible. As is normal for such calculations, the swing is applied uniformly to all the constituencies.
There are three suppositions that we obtain and all of them yield different estimates. The final and fourth estimate is based on my judgement call on the swing model and other models (assumptions).
Congress’ Vote History: Revival Most Unlikely
Chart 12.1 reports both the vote share and seats obtained for all the last sixteen elections. What we observe is that the Congress held on to a steady vote share of around forty-five per cent till the mid-1970s. It lost about one ppt of vote per year between 1980 and 1996, and stabilised at around twenty-eight per cent till (and including) the 2009 election. Since then, there has been a large jump downwards of around nine ppt as witnessed in 2014. 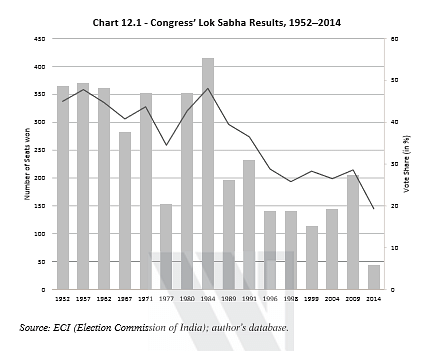
The state elections subsequent to the last Lok Sabha election have also not been encouraging for the Congress. The weighted vote share in state elections post 2014 averaged 21.9 per cent compared to 23.1 per cent between 2009 and 2014. The post-2014 number includes the Congress’ wins in the Hindi heartland in November 2018. The BJP, on the other hand, increased its vote share by a robust eight ppt; from 19.7 per cent between 2009–2014 to 27.6 per cent between 2014–2018.
Yield of Votes—Vote Share Per Seat
If the Congress were to move from nineteen per cent of the national vote to twenty-three per cent, there would be a swing in its favour of four ppt. One method of estimation (forecast) involves approximating the yield per vote i.e., what are the number of seats a party can expect if its vote share increases (or decreases) by one per cent?
This is where the Congress story, in terms of numbers, becomes somewhat alarming.
Chart 12.2 documents the historical yield for the INC. In most elections, the Congress obtained approximately seven seats for each one per cent vote share. Although there are fluctuations, there is also a broad consistency—i.e., until 1989 when the Congress yield was at nearly the same level as in the 1977 ‘Emergency election’.
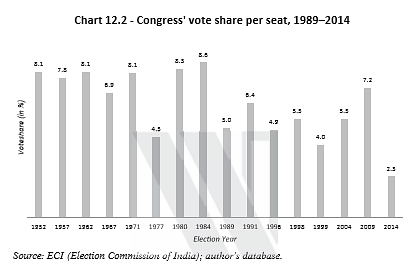
In hindsight, I would say that this was a ‘surprise’ result; most of us believed that the 1977 election result was a genuine Emergency-induced aberration, yet the polling data suggests that the ‘Bofors’ election in 1989, was just as bad. There is however a short recovery in the INC yields, before the resumption of the downward trend. If the 2009 outlier is ignored, then the 2014 yield matches the prediction of the ‘trend line’ from 1991 onwards.
What kind of recovery in seat yield can be expected in 2019? The first marker in this recovery is four, which is the strike rate obtained in 1999. If this were to happen, the recovery rate, co-incidentally, would be almost the same as obtained by Indira Gandhi in 1980 (the move then was from 4.4 in 1977 to 7.6 in 1980). If both these events were to happen (the Congress’ vote share increase of five per cent to 24.3 and the strike rate increase from 2.3 to four), then one obtains a forecast of ninety-seven seats for the party.
This ninety-seven seat forecast is based on the assumption that the people of India are as frustrated with the Modi regime in 2019 as they were with the Congress in 2014. If this assumption is unrealistic, and I believe it is, then the Congress will have to be satisfied with a number considerably below ninety-seven.
A realistic possibility is a three ppt increase in the vote share to twenty-two per cent and a recovery of strike rate to three; this yields a figure close to sixty-nine seats for the Congress. All of us can of course play with these numbers (that is why the historical record has been presented) and come up with our own guesstimates.
What Do the 2014 Margins Say About 2019?
Table 12.1 presents a complete picture of how the INC fared in 2014. Out of 543 seats, the Congress won just forty-four and lost 420. The frequency distribution of the wins and losses are also presented in the table, which is according to the margin of victory (or loss)— the winning margin is the difference between the voting percentage of the party (Congress) and the party which is in second position in a given constituency. For calculating losses, the margin is the difference between the vote share of the losing party and the vote share of the winning party. 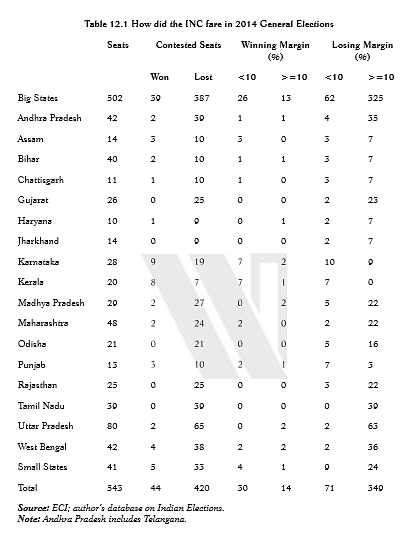
If a positive swing is assumed, then it means that the seats won in the previous election are retained. The analyst can now choose to forecast from a menu of assumptions about margins. If the assumption is made that there is a positive swing of five per cent, then the Congress can be expected to win seventy-eight seats—forty-four that it won in 2014, plus the thirty-four that it lost by five ppt or less. This is Scenario 1 (referred to as Sc1).
Two other assumptions about the magnitude of the swing yield the upper bound (swing of 7.5 per cent) and lower bound (a ‘mixed’ swing of five per cent i.e., it wins all the seats that it lost with a margin of five per cent, but loses half the number of seats it won with a margin of less than five per cent). 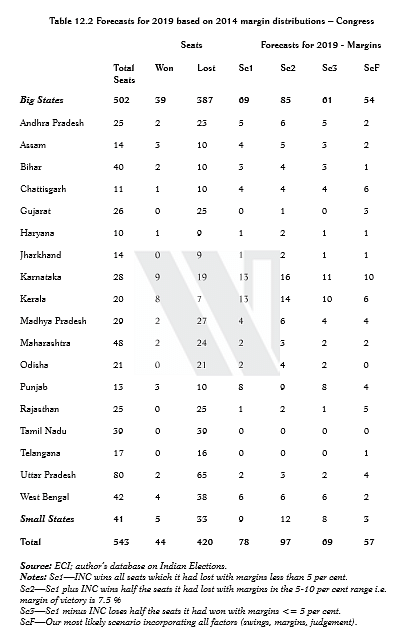
Scenario 2 incorporates the assumption of a very large 7.5 per cent increase in vote share— as mentioned earlier, such a large swing would bring the Congress back to its glory of the last twenty years or so. But even this large assumption gets the Congress back to only ninety-seven seats. Interestingly, this is equal to, or slightly less than, the consensus of the opinion polls.
The third estimate is essentially the Sc2 estimate (ninety-seven seats) minus half the low margin (<5 per cent) winning seats that the Congress might lose. By definition, we relax the assumption of a uniform swing with this supposition. Even this loss is expected to be half of the nineteen seats won by the INC with a less than five per cent margin. This yields an estimate of sixty-nine seats for the Congress — a twenty-five seat jump from the 2014 result.
The final column labelled ScF, is the forecast for the Congress on its own in 2019. This includes the information contained in Scenarios 1 through 3 plus our judgement of the likely outcome. The previous three estimates were mechanical in nature i.e., they conformed to the principle of Untouched By Human Hands or UBHH (these forecasts do not incorporate the changing alliances and seat arrangements between different parties). In the aggregate, one obtains only fifty-seven seats for the Congress, just a thirteen seat jump from the low forty-four seats that it got in 2014. The good news is that Karnataka is likely to be the only state with a double-digit outcome in 2019—in 2014, in no state did the Congress reach this milestone.
Finally, the Congress’ seat forecast points towards two facts—history and math are not in its favour. If one is proven wrong, and the Congress reaches the triple-digit mark forecast by opinion polls, it will be on a strong path to recovery. If one is proven right, then the Congress will very likely have to re-invent itself, and seriously stop being feudal and dynastic. Election 2019 is show time for the Congress party.
 This excerpt from ‘Citizen Raj: Indian Elections 1952-2019’, written by Surjit S. Bhalla, has been published with permission from Westland.
BJP has 11.6 cr members, 17.6 cr mudra loan seekers, 6.7 cr LPG gas cylinders who were cooking on wood, 7.5 cr toilet beneficiaries, Apart from these RSS ,VHP etc are with BJP. Urbanites are there. Taking some as common beneficiaries and allow high margins, let us say 24 cr ppl vote for BJP . If pollin % is 60% then 54cr will vote out of 90cr. So BJP will get say 24 cr out of 54 cr. Which is whopping 44%. Allow further error of 10% gives 40% vote share. With this vote share 295 plus seats is possible for BJP.
It seems that the ground reality is different Congress support is swelling phase after phase. Silent wave is on and Congress will win more seats than what BJP pollsters and media predicts
Highly manipulated article on favour of Congress. Not real and real facts are superseded.. This more looks like Congress propaganda.