

India is home to nearly one-third of all stunted children in the world, i.e., children under 5 years whose height relative to their age is below the acceptable range of global variation. Not only that, the average incidence of stunting in India is higher compared to the average of 30 countries in Sub-Saharan Africa (SSA).
Child height is typically negatively correlated with poverty, as stunting is one of the manifestations of chronic malnutrition. Therefore, the fact that Indian children are shorter than their counterparts in SSA is counter-intuitive, as India is a richer country. This puzzle, called the “Indian Enigma”, has led to serious enquiry in the form of significant academic papers that have tried to solve this puzzle (Deaton, 2007). The predominant explanations for this phenomenon are birth order and son preference: (Jayachandran and Pande, 2017) first-born children are not shorter, but the height gradient kicks in from the second child onwards, especially if the child is a girl), the high prevalence of open defecation, i.e., the disease environment (Spears, 2018), and genetic differences (Panagariya, 2013). Note that the evidence presented by Jayachandran and Pande as well as by Dean Spears raises a serious question mark against genetic explanation.
Our first look at the child height data revealed a picture that, we were surprised to find, had been overlooked in the literature. See Figure 1.
Figure 1
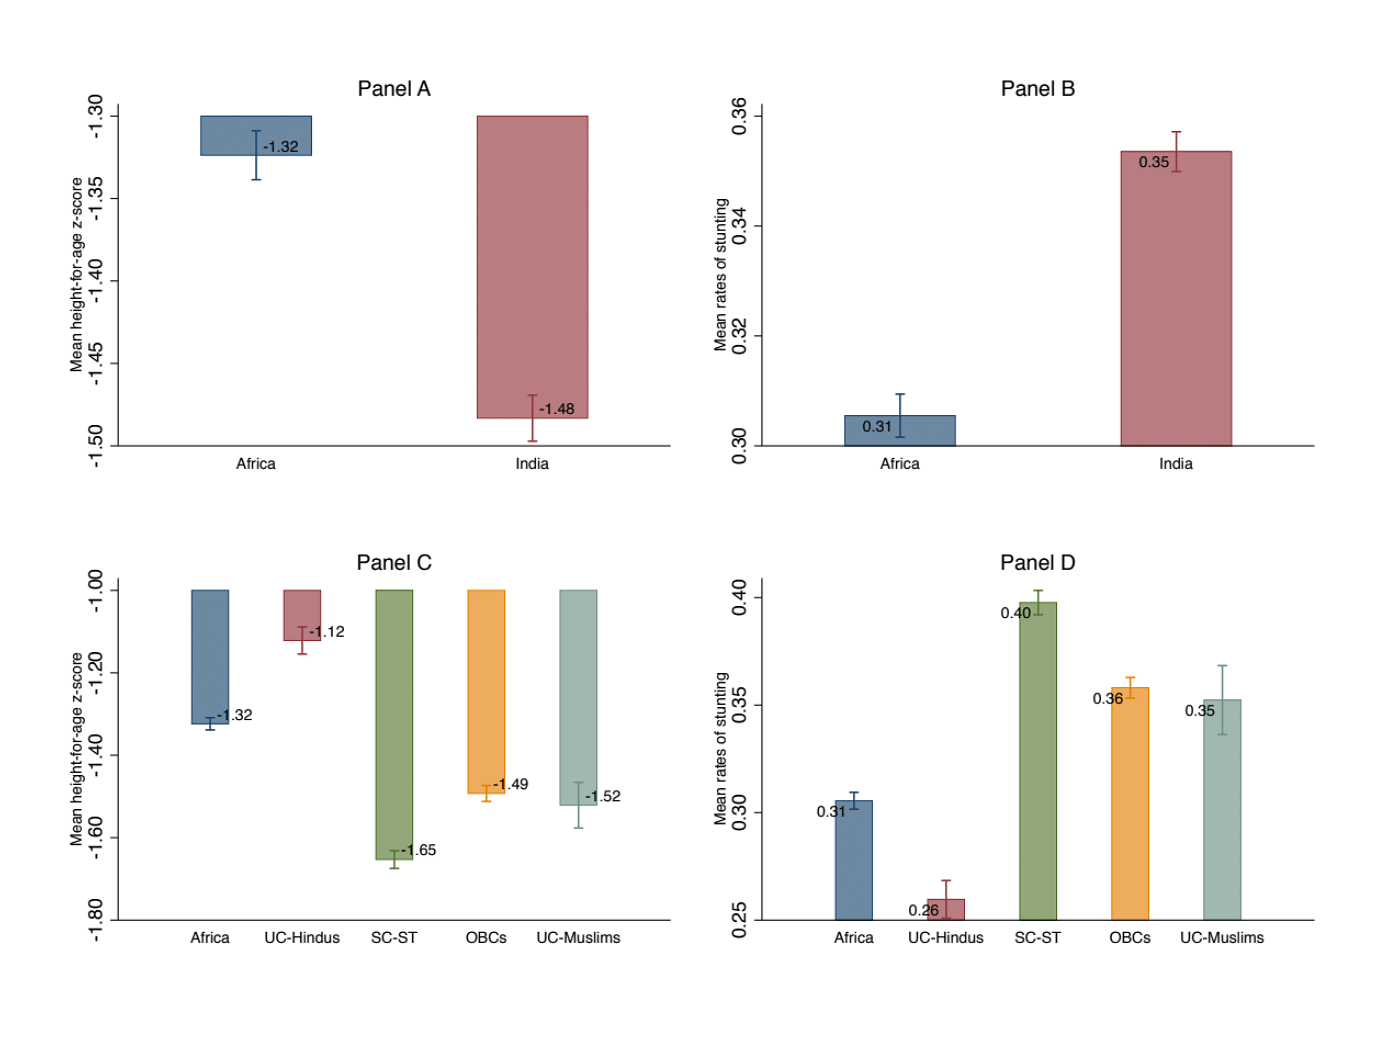
Figure 1 includes data from 30 countries in sub-Saharan Africa (SSA), which have a combined under-five population of 132 million and India with an under-five population of 121 million. These data are from the latest round of the Demographic and Health Survey (DHS); with data for India from 2015-16 and for SSA from the latest round later than 2010.
Panel A of Figure 1 plots the average height-for-age Z score (HFA Z-score) [1]. Indian children have an HFA Z-score of -1.48, which is an additional 0.16 standard deviation units less than the SSA average of -1.32. The rate of stunting is plotted more directly in Panel B: the proportion of children who are more than 2 standard deviations below the world reference median. This panel shows that childhood stunting is 13 percent higher in India than in SSA (36 versus 31 percent). This part of the picture is well known and widely analysed by the literature referred to earlier.
Also read: NFHS shows stunting increased in ‘better-performing’ Kerala, Goa. India must not lose focus
The missing link: The role of social identity
The India-SSA comparison, however, elides over the crucial inequalities that exist within Indian society. In Panel C and D of Figure 1, we plot the average HFA Z-score and rates of stunting for SSA and the four major social groups in India: the upper caste Hindus (UC-Hindus), Scheduled Castes and Tribes (SC-ST), Other Backward Classes (OBCs) and upper caste Muslims (UC-Muslims, i.e., Muslims that don’t identify themselves as SC or OBC). The four-way classification accounts for the two key cleavages in Indian society: caste and religion.
Panel C of Figure 1 reveals a pattern that had hitherto been missed in the stunting discussion: the height disadvantage for all groups, other than UC Hindus, is higher compared to SSA children. Panel D shows the same thing differently: rates of stunting are far lower among UC children. 31 percent of children in SSA are stunted. With a stunting incidence of 26 percent, UC-Hindu children are 5 percentage points less likely to be stunted than children in SSA. 40, 36 and 35 percent of the SC-ST, OBCs and UC-Muslim children, respectively, are stunted. Thus, the SC-ST, OBCs and UC-Muslim children are 14, 10 and 9 percentage points, or 35 to 50 percent, more likely to be stunted compared to the UC- Hindu children.
In other words, the gaps in child heights between the social groups in India are two to three times greater than the India-SSA child height gap. The entire India-SSA child height gap is accounted for by the lower child heights of disadvantaged groups.
The patterns shown in Figure 1 indicate that the question “why are Indian children shorter than African children” needs to be rephrased to “why are the gaps in child height between social groups within India so high?”
We address this in our latest paper. In this data narrative, we present some of the salient features of childhood stunting in India.
Also read: If India can look after pregnant women so well, why are more under-5 kids wasting & stunting
Regional variation
When we examine the sub-national variation in incidence of stunting, we find both regional and social group variations. We present estimates from the National Family and Health Survey for 2015-16 (NFHS-4).
Table 1 shows the number and share of districts by social group by the incidence of stunting. These are also shown in Figures 2- 5, which plots colour coded heat maps showing the spatial distribution of the average proportion by district and social group, where the thin black lines depict the district boundaries and the thick black lines the state boundaries and the prevalence of stunting is increasing in the intensity of the colour.
Figure 2
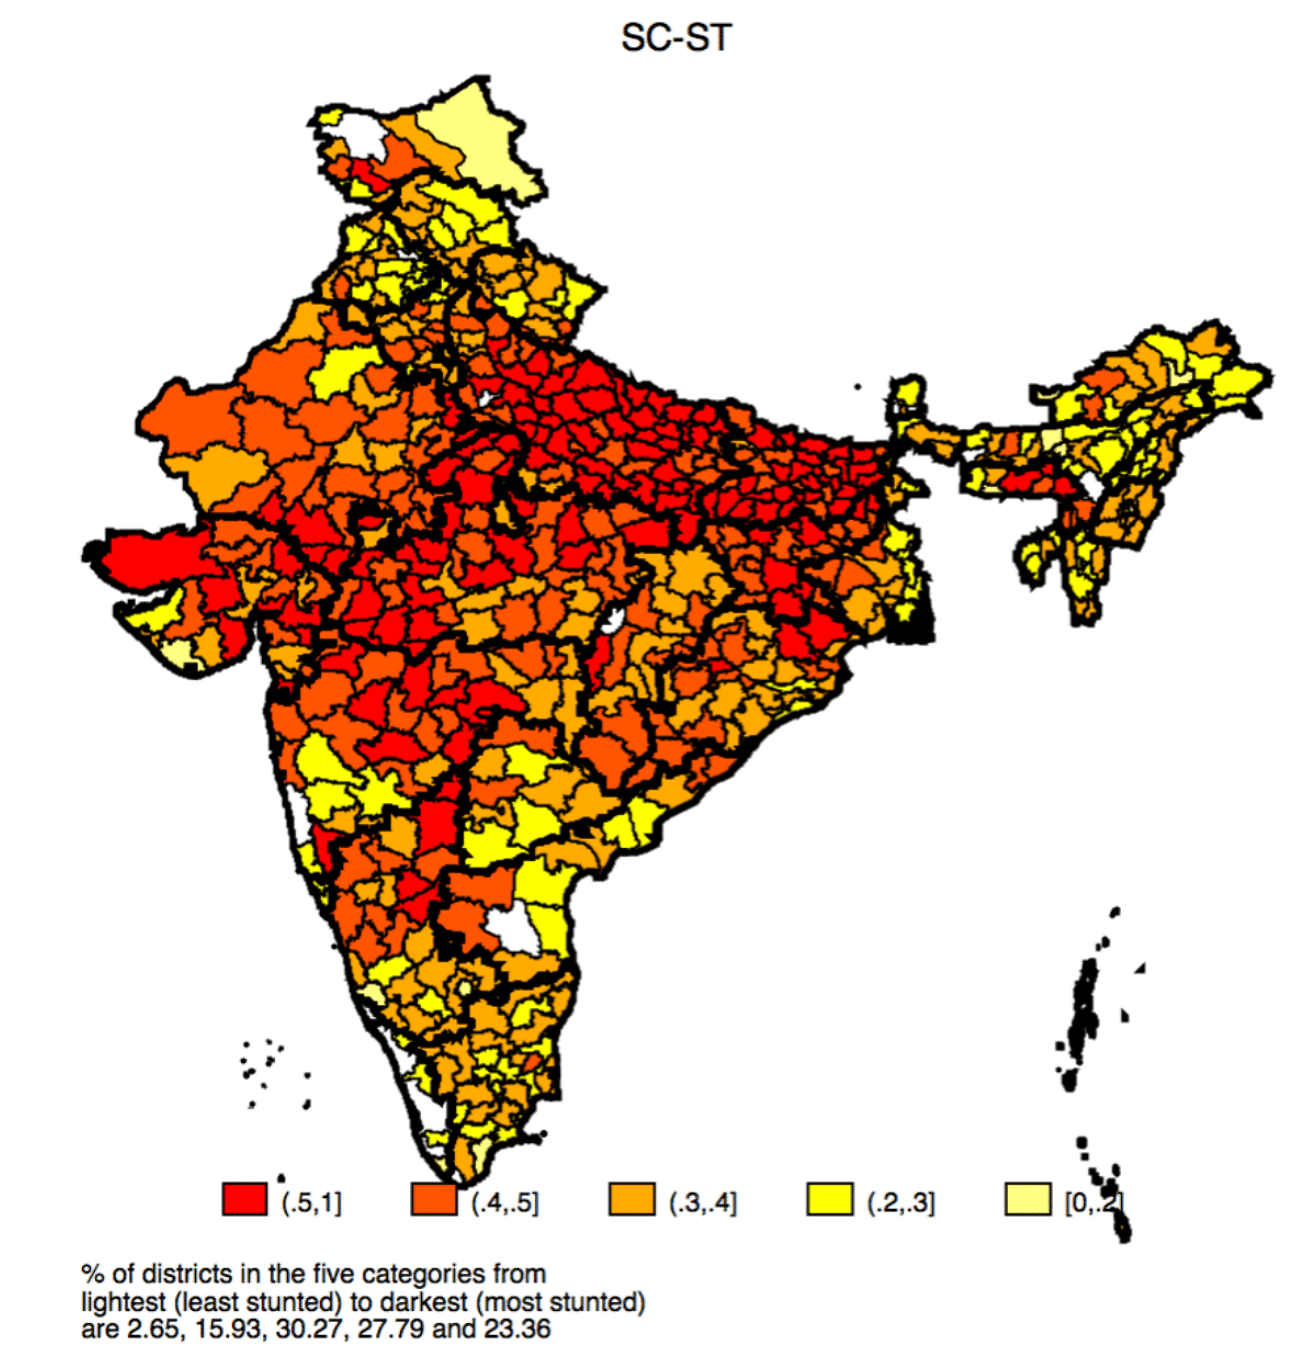
Figure 3
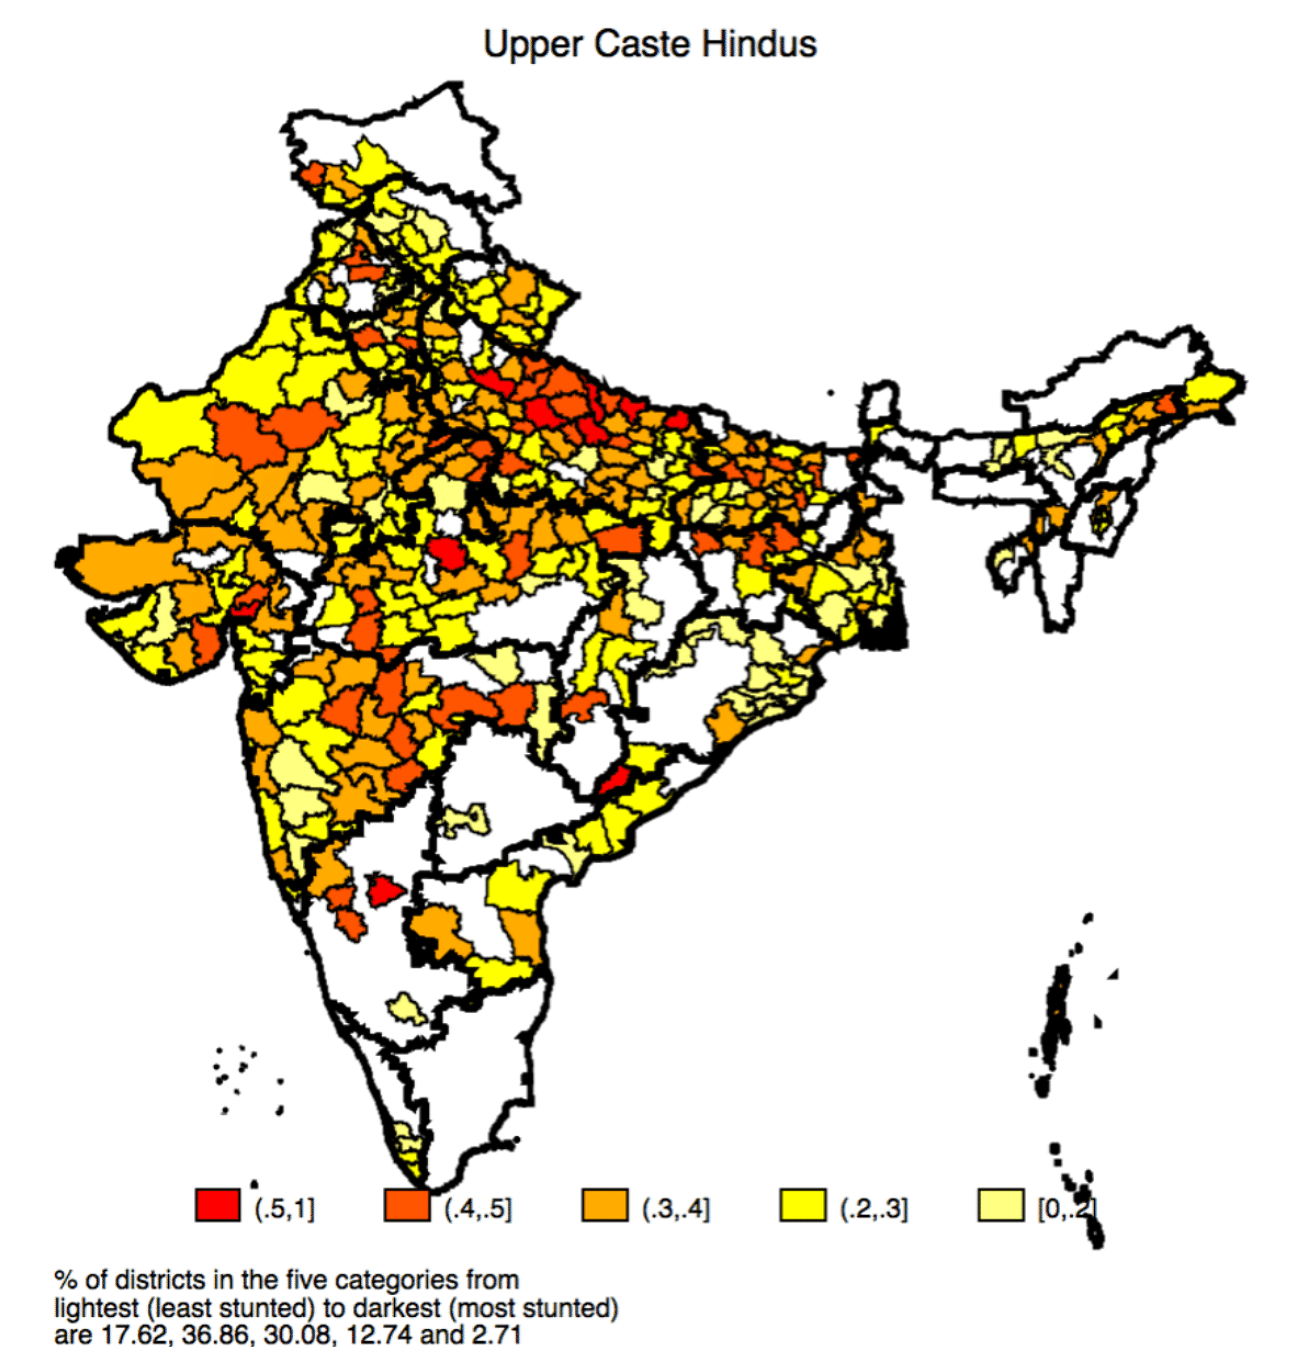
Figure 4
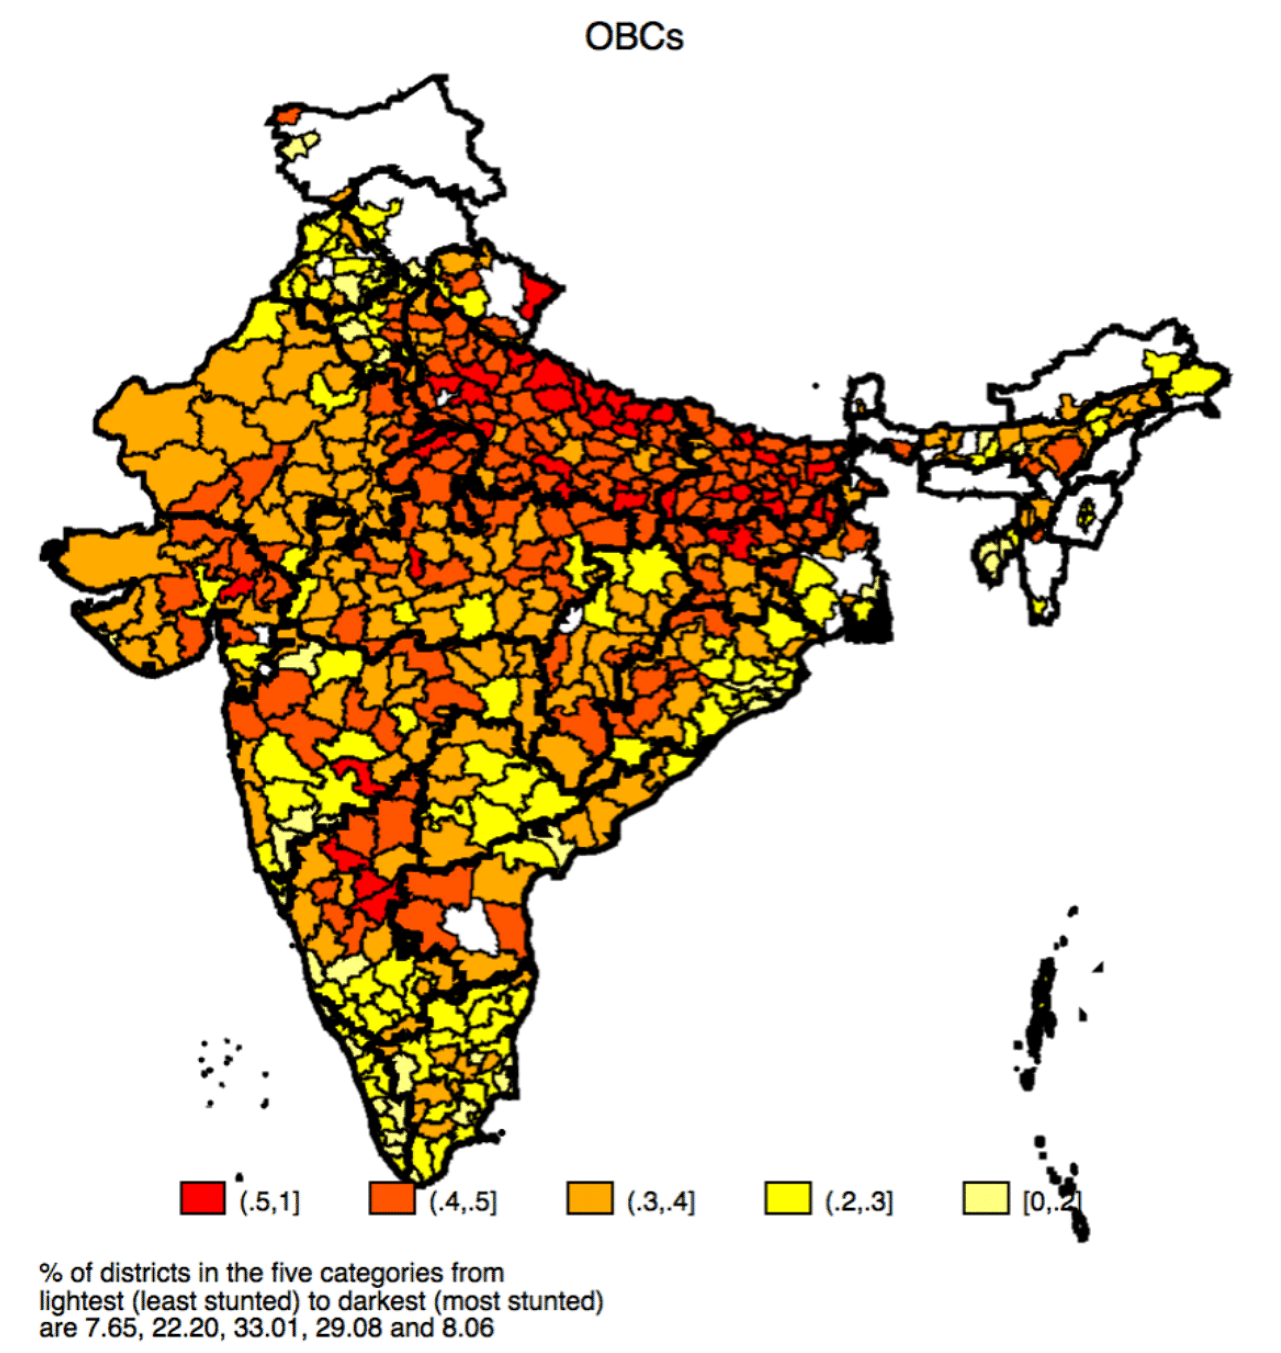
Figure 5
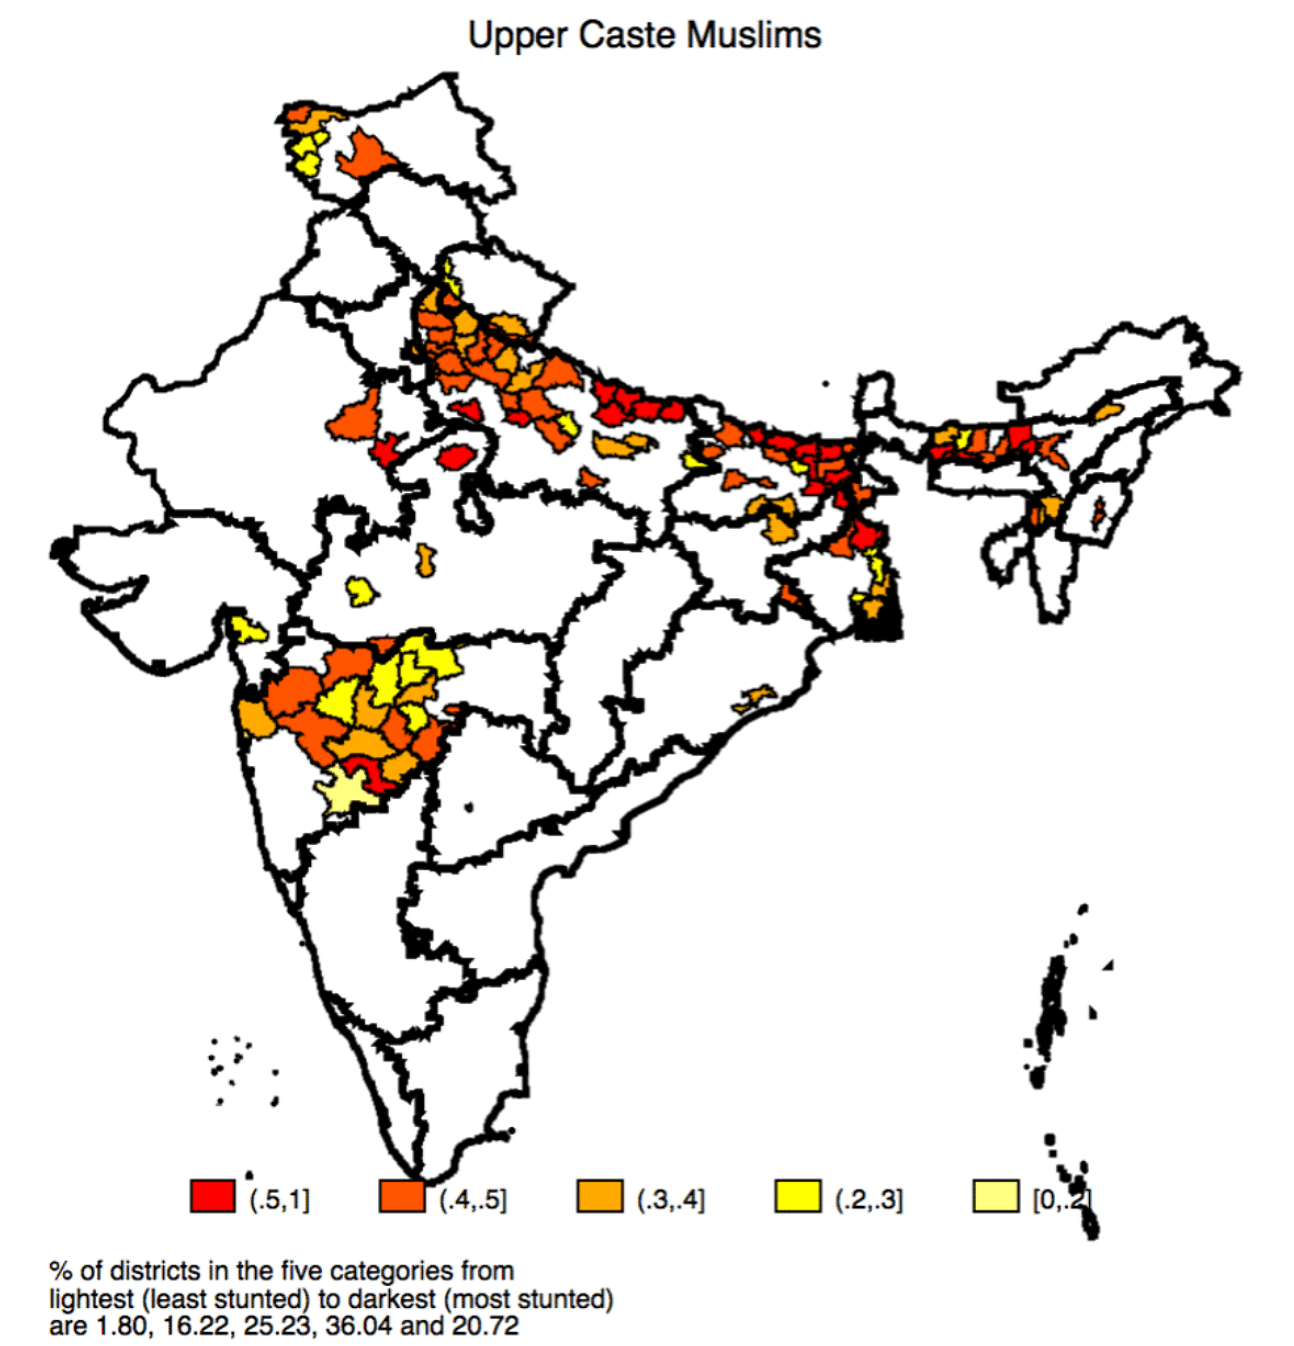
Table 1: Prevalence of stunting by social groups
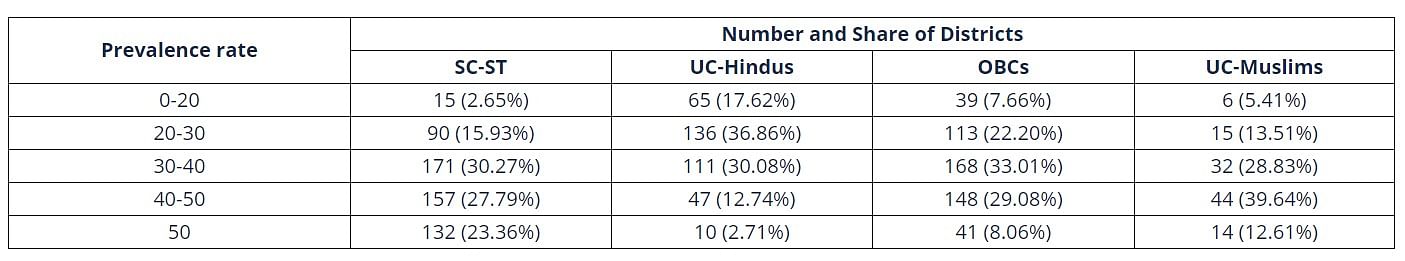
Table 1 shows that for SC-ST children, in 15 districts (2.65%), the average incidence of stunting is between 0 and 20 percent; in 90 districts (15.93%) it is greater than 20 and less than equal to 30 percent; in 171 districts (30.27%) it is greater than 30 and less than equal to 40 percent; in 157 districts (27.79%), it is greater than 40 and less than equal to 50 percent; and in 132 districts (23.36%), it is greater than 50 percent. The corresponding number and share of districts showing the spatial variation in incidence of stunting for other social groups can be seen in Table 1.
Summing up, the proportion of districts where rates of stunting are more than 40% (i.e., extremely high) are 15% for UC Hindus; 37% for OBCs; 51% for SC-ST and 57% for UC Muslims.
In terms of regional patterns, the Figure 2 shows a very clear pattern with the areas with the highest prevalence for SC-ST concentrated in the states of Bihar, Chhattisgarh, Jharkhand, Madhya Pradesh, Rajasthan, and Uttar Pradesh, as can be seen by the northern and central plains being largely red in colour. More specifically, for the SC-ST children in the BIMARU region, in 195 or 84% of the districts the prevalence of stunting is greater than 40 percent; and in 105 or 44.49% of the districts more than half the children are stunted. The BIMARU region stands in stark contrast to the southern and northern regions; not only is the prevalence of such extreme levels of stunting lower across all caste groups but also the extent of differences across caste groups are much smaller. For the upper castes, in the BIMARU region, in only 38 (16) percent of the districts the prevalence of stunting is greater than 40 (50) percent. For the OBCs and upper caste Muslims, in the BIMARU region, the prevalence of stunting in 61 and 71 percent of the districts, respectively, is greater than 40 percent.
Also read: Lack of healthy food in school yrs caused 20 cm height gap across nations, study finds
What accounts for the gaps between social groups and regions?
We identify five important categories of factors that affect child height, namely: (i) lack of access to sanitation, captured by two variables: no household access to toilet facility and household members defecating in a bush/field; and the exposure of a household to open defecation at the primary sampling unit level; (ii) the mother’s human capital, measured by two indicators: years of schooling and ability to read measured by an actual test; (iii) mother’s anthropometric status as captured by the HFA Z-score, the weight-for-height (WFH)-Z score and age; (iv) asset differences as captured by the wealth index factor score; and (v) intra-household allocation and fertility decisions, proxied by birth order and sibling size.
We find large intergroup differences in the covariates that affect child height, especially between UC-Hindus and SC-ST. To highlight a few, 58 percent of SC-ST households have no access to a toilet facility and defecate in a bush/field, compared to 23 percent UC-Hindus; maternal literacy is 83 percent for UC-Hindus compared to 51 percent for SC-ST; SC-ST mothers have 5.26 years of schooling compared to 9.47 for UC-Hindu mothers; and the average HFA Z-score of UC-Hindu mothers is -1.82 compared to -2.15 for SC-ST mothers.
Clearly there are large and significant differences in the environment that upper caste and Dalit children grow up, with the circumstances being much more adverse for Dalit and Adivasi (SC-ST) children. Do these differences in socio-economic characteristics explain the child height gap between social groups?
Using Entropy Balancing, a methodology that enables us to compare like-with-like, we examine differences in stunting in “matched” samples of upper caste and Dalit children, i.e., children whose socio-economic characteristics are matched along major dimensions. We find that in our matched sample BIMARU states, SC-ST and OBC children are likely to be shorter than upper children. This suggests that the greater stunting among children of low-ranked castes is not only because of their relatively more disadvantaged circumstances.
We suggest that the gaps between Hindu UC and Dalit (SC) children is affected by societal discrimination, manifested in the illegal but widespread practice of untouchability (Shah et al., 2006; Acharya, 2010; Coffey et al., 2019). Dalit children’s height disadvantage increases in districts where the self-reported practice of untouchability is higher. We use data from India Human Development Survey (IHDS 2012) to estimate the association between the practice of untouchability and child height.
Figure 6
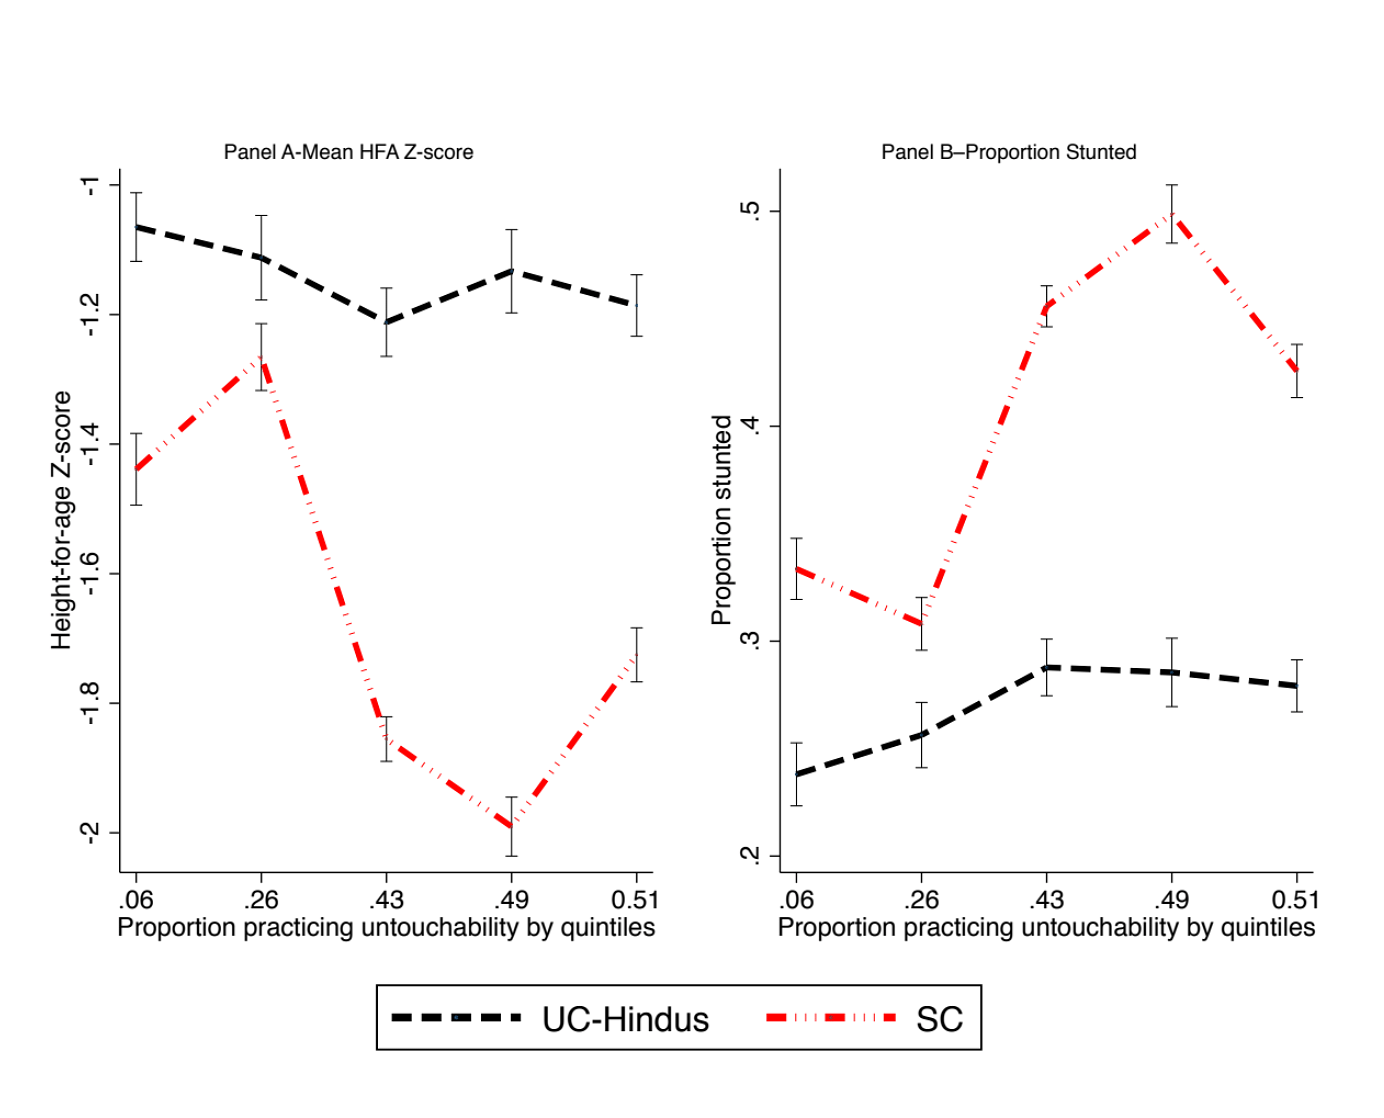
Figure 6 shows that Dalit children’s HFA Z-score sharply decreases in areas where the practice of untouchability is more prevalent. In contrast, there is a much weaker association between height/chronic malnutrition levels and the proportion of households reporting practicing untouchability, for upper caste children. We also explore the impact of the practice of untouchability on the whole pathway of child development. Our results show that the areas where households are more likely to engage in the practice of untouchability are the same areas as those where SC mothers and children are less likely to be able to access or use a whole range of antenatal and postnatal health inputs.
Also read: Number of stunted children in India fell 30% in a decade, but it’s slow progress
Concluding comments
Our results on caste-as-a-missing-link shows that the caste gaps in child height are not entirely a reflection of class or socioeconomic status (SES) differences. While caste groups differ on an extensive set of covariates that are determinants of child height, we show that sizable gaps remain even when comparing samples that are balanced on the same set of covariates.
The evidence shows that the illegal, but widespread, practice of untouchability is positively associated with height gaps between upper and lower-caste (Dalit) children. In particular, variation in the practice of untouchability does not affect the height of upper caste children, but higher spread of untouchability-related practices is associated with lower heights of Dalit children. The results moreover suggest a role for discriminatory practices in affecting service delivery to pregnant and nursing mothers from stigmatized groups and consequently the health outcomes of lower caste children.
Note: [1] This is the number of standard deviations of the actual height of a child from the median height of the children of his/her age as determined from the World Health Organization child growth standards (WHO Multicentre Growth Reference Study Group, 2006)
Ashwini Deshpande is a professor of economics at Ashoka University. She tweets @AshwDeshpande.
Rajesh Ramachandran is a postdoctoral researcher at the faculty of economics at Heidelberg University.
This article was originally published by the Centre for Economic Data and Analysis (CEDA).